Fig. 3.
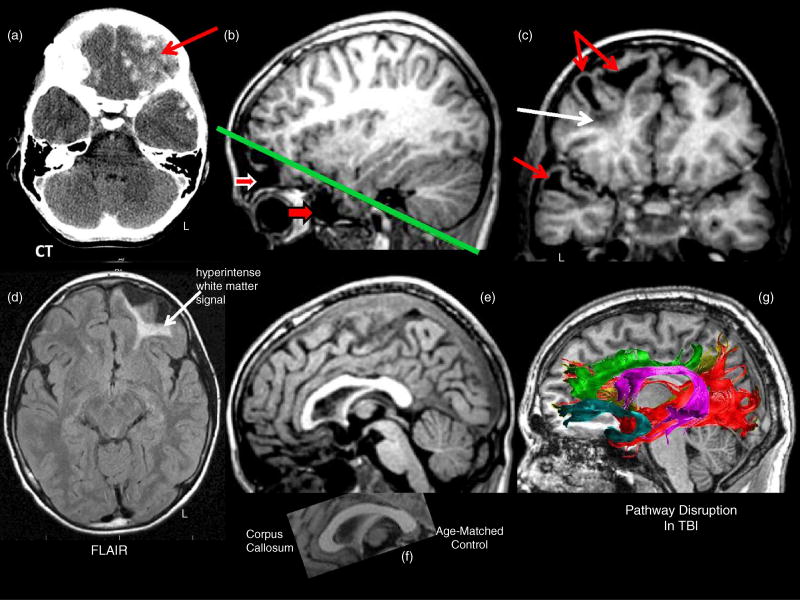
(a) Day-of-injury computed tomogram (CT) showing extensive hemorrhagic lesions (white scattered lesions) especially notable in the inferior left frontal region (red arrow). (b) The sagittal T1-weighted MRI obtained four years post-injury shows extensive left anterior inferior frontal (top red arrow with white border) and temporal pole (bottom red arrow with dark border) wasting, referred to as encephalomalacia. The green line depicts the orientation of the oblique coronal cut as shown in (c). The particularly dark signal (white arrow) underlying the focal encephalomalacia represents hemosiderin. (d) In contrast, the MR signal in the white matter regions of the frontal and temporal lobes as depicted in the T1 images is abnormal, but not as distinct as the hyperintense signal in the axial fluid attenuated inversion recovery (FLAIR) sequence. T1 mid-sagittal MRI showing reduced size of the anterior aspect of the corpus callosum (e) in comparison to an age-matched control (f). (g) Pathways in the normal brain that would normally course through what is now damaged parenchyma and thus would be damaged in the TBI patient. These include, in addition to the corpus callosum, the anterior cingulum (green), occipitofrontal fasciculus (brown), uncinate fasciculus (teal), occipitotemporal fasciculus (red), and arcuate fasciculus (purple).

