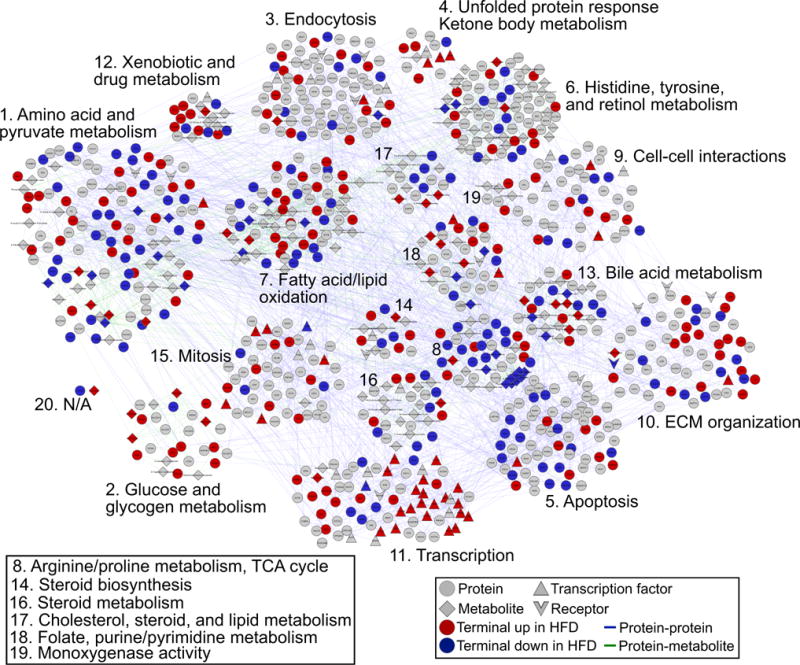
Figure 4. Multi-omic PCSF Model Uncovers Features of Hepatic Insulin Resistance.

The full PCSF model includes 398 terminal nodes and 509 predicted Steiner nodes connected by 2,365 interactions. We divided the solution into 20 sub-networks and highlight the specific biological processes contained within these. Colored nodes (red or blue) represent terminal nodes, gray nodes represent Steiner nodes, and shapes indicate node types (proteins, metabolites, transcription factors, or receptors).
See also Figures S5 and S6.
