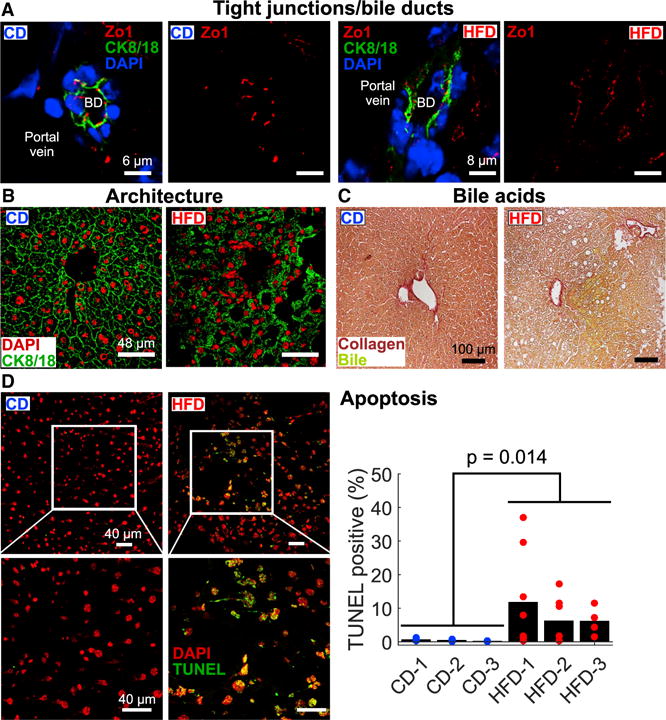
Figure 6. Hepatic Imaging Validates Global PCSF Model Predictions.

(A) HFD-induced changes in tight junction structure near bile ducts (BD) as assessed by cytokeratin 8/18 (CK8/18) and Zo1 staining. Scale bars: for CD, 6 μm; for HFD, 8 μm.
(B) CK8/18 staining revealed overall hepatic architectural defects in HFD samples. Scale bars, 48 μm.
(C) We observed enhanced bile acid leakage in HFD livers stained for collagen and bile/bilirubin compared to CD livers. Scale bars, 100 μm.
(D) TUNEL imaging revealed enhanced regions of hepatocyte apoptosis in HFD samples. Points on graph represent values from individual fields of view (ns = 9, 7, and 4 for HFD livers; ns = 4, 5, and 5 for CD livers), and bars indicate overall TUNEL-positive fraction (total TUNEL-positive cells over total cells) based on all fields of view. We found that the overall difference in TUNEL staining between the diets is statistically significant by two-tailed t test (p = 0.014). Scale bars, 40 μm.
