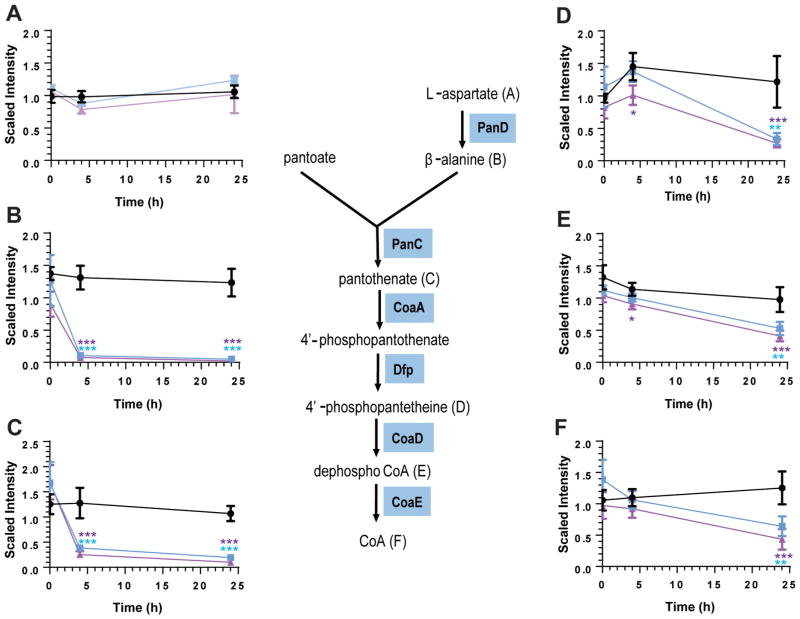
Figure 1.
Effect of POA treatment on the levels of intermediates of the coenzyme A biosynthetic pathway. Intracellular levels of (A) aspartate, (B) β-alanine, (C) pantothenate, (D) phosphopantetheine, (E) 3′-dephospho coenzyme A, and (F) coenzyme A at time points 0, 4, and 24 h after treatment with no POA (black circles), 1 mM POA (blue squares), and 4 mM POA (purple triangles) are represented as scaled intensity, which are obtained by quantification of individual peaks from spectral data using area-under-the curve, normalized for the respective sample by total protein concentration as determined by the Bradford assay. Phosphopantothenoyl-L-cysteine, an intermediate in the production of 4′-phosphopantetheine (reaction catalyzed by CoaBC), was not detected in our experiments. Experiments were carried out in 4 independent biological replicates. Mean and standard deviations from these 4 replicate experiments are shown. Means were significantly different from levels of respective metabolites in untreated controls at respective time points at p <0.05 (*), <0.01 (**), <0.001 (***), one-way ANOVA multiple comparisons test, GraphPad Prism. Statistical significance is indicated by blue and purple asterisks for 1 and 4 mM POA treatment, respectively.

