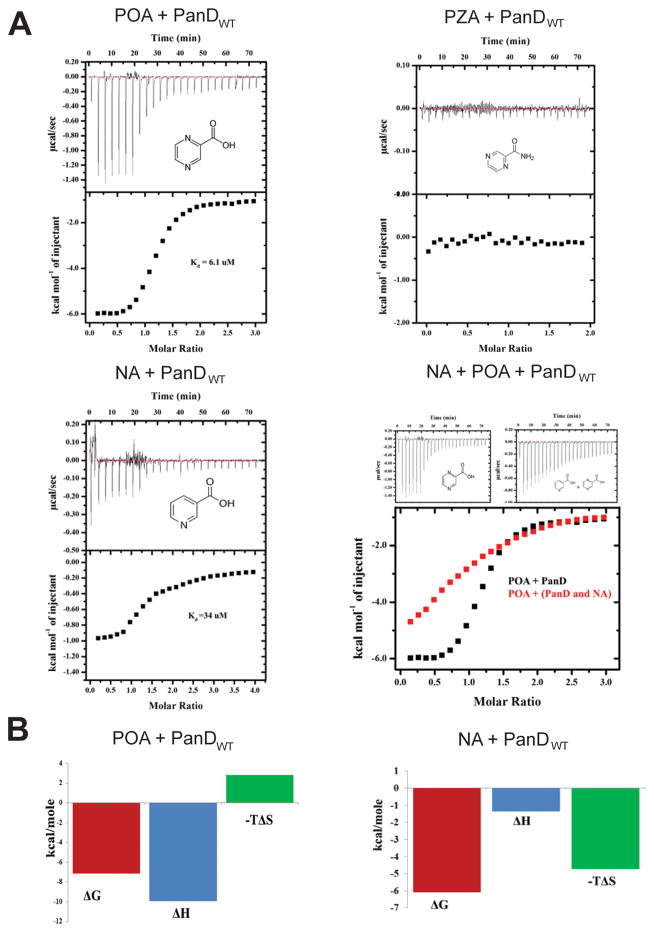
Figure 4.
Binding affinity measurements for POA, PZA, and nicotinic acid (NA) with PanDwt using ITC. (A) Representative ITC profiles are shown. The top panel in the figures shows the injection profile after baseline correction. The bottom panel shows the integration (heat release) for each injection. The solid lines reveal the fit of the data to a function based on a one-site binding model. NA + POA + PanDwt shows the results of a competitive titration where PanD was incubated with nicotinic acid for 15 min before titration with POA. (B) Thermodynamic signature plots of POA and NA binding to PanDwt as deduced from the isothermal titration calorimetry profiles (see Materials and Methods).

