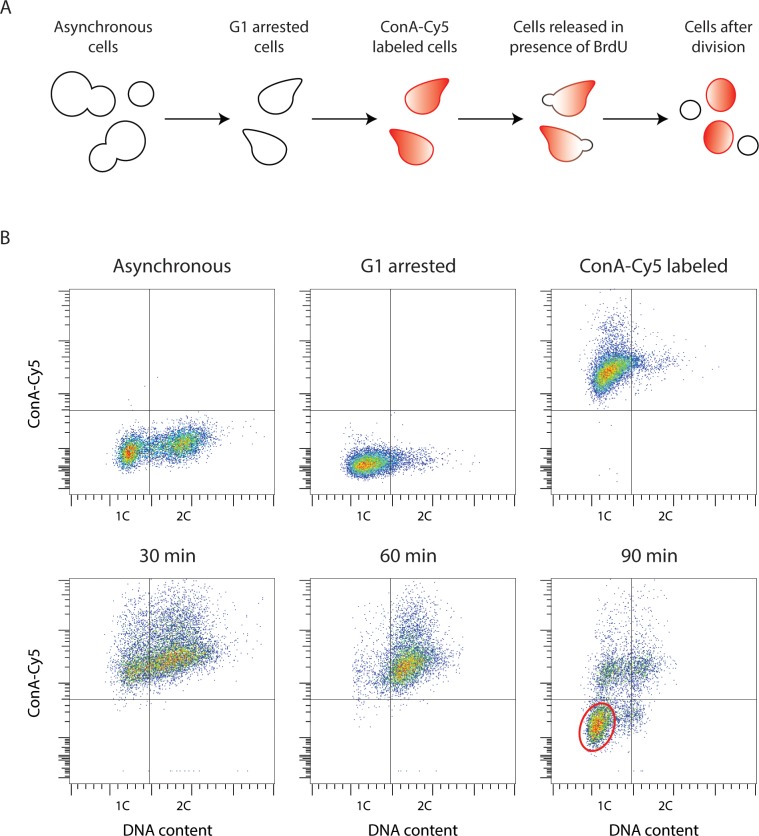
Figure 7. Yeast Strand-seq via the 'single cell sorting' approach.
(A) Scheme of the ‘single cell sorting’ approach for yeast Strand-seq. (B) Representative flow cytometry scatter plots corresponding to the scheme depicted in (A). Cells appearing in the lower left quadrant in the 90 min post-release sample are newly divided daughter cells to be sorted. A typical window for sorting is shown by the red oval.

