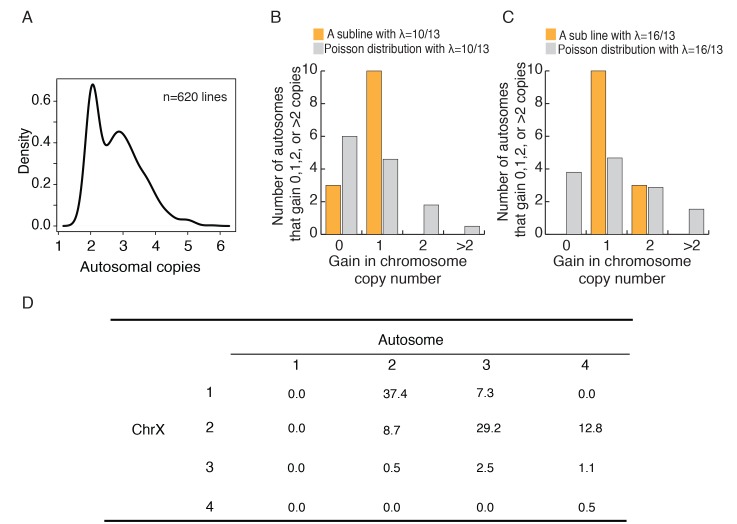
Figure 4. Autosomes change in a cohesive manner and coevolution of X and A.
(A) The density plot of autosome copy number among 620 cell lines shows peaks at 2 and 3 per autosome. (B-C) The observed distributions of gain in copy number among autosomes in two HeLa sublines. The expected Poisson distributions are also given for sublines with different means (λ = 10/13, 16/13; see text). (D) The percentages of C(Xa:A) types among the 620 cell lines.
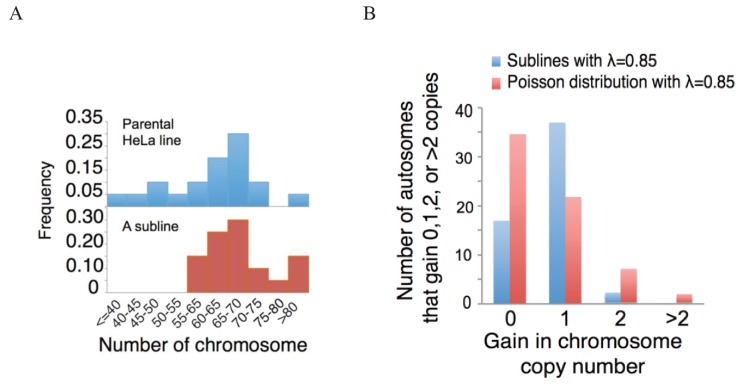
Figure 4—figure supplement 1. Both the ancestral and sub-clonal HeLa population have 55–75 chromosomes centering around the triploid count of 69.
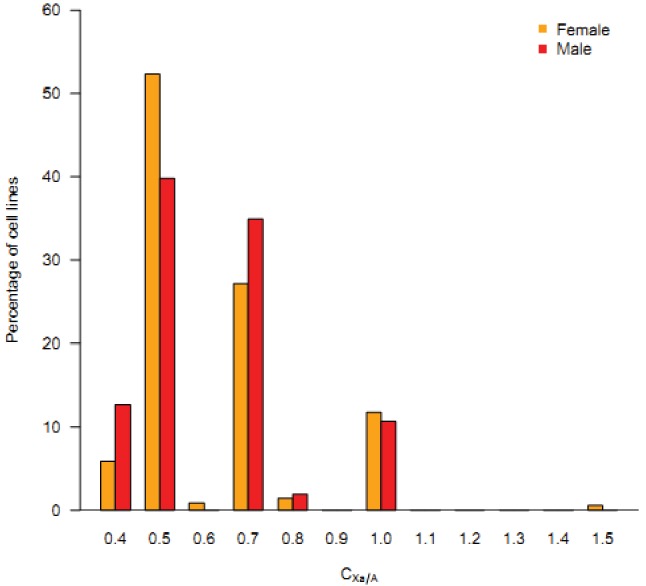
Figure 4—figure supplement 2. The frequency spectrum of C(Xa:A) across all male and female cancerous cell lines.


