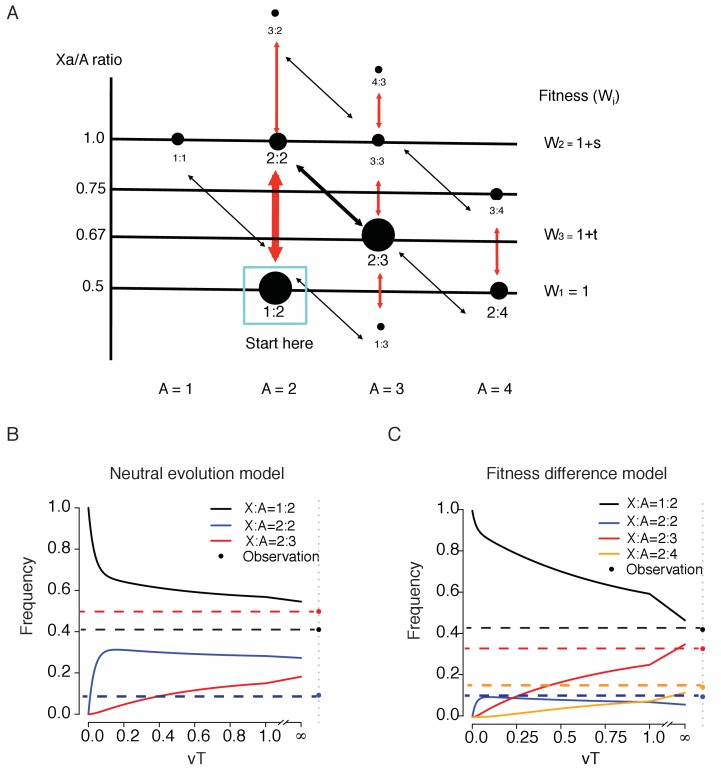
Figure 5. A model of karyotypic evolution driven by fitness differences.
(A) Evolutionary pathways of chromosomal changes. Each node represents a karyotype C(Xa:A) and the size roughly corresponds to its frequency. Cell fitness is assumed to be a function of the Xa/A ratio, which is represented by the Y-axis. The four abundant karyotypes are shown by solid black circles. Red arrows indicate faster changes in X and black arrows indicate slower changes in autosome. Main transitions between the common karyotypes are indicated by thicker arrows. (B) Changes in the frequencies of the three key genotypes as a function of time (T, expressed in units of 1/v) under fitness neutrality with all Wi’s = 1. The parameters for Equations 1 and 2 are u = 10 v, a = 2 and b = 1.5. Both the theoretical trajectories and the observed values are given. The C(2:3) cluster (x3) is far more common in the observation than in the neutral model. (C) Changes in 4 karyotypic frequencies under selection according to Equation S3 with s = −0,5 and t = 0.5. All other conditions are the same as above. Under selection, a reasonable agreement between the model and the observation can be obtained.

