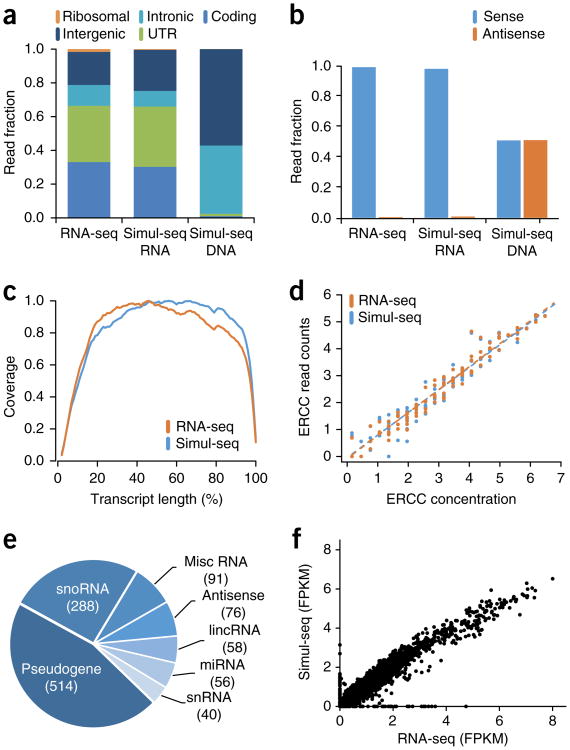
Figure 3.
Characterization of Simul-seq transcriptome data. (a,b) Genomic distribution and strand specificity of Simul-seq RNA-indexed reads compared to RNA-seq control. Simul-seq DNA-indexed reads are included as a control. (c) Distribution of normalized transcript coverage for Simul-seq and RNA-seq transcriptome data. (d) Correlation between External RNA Controls Consortium (ERCC) spike-in control log10 RNA concentrations versus the average log10(RPKM) for Simul-seq (Spearman's ρ = 0.97) and RNA-seq (Spearman's ρ = 0.98) replicates (n = 2). Note, RPKM values of 0 have been shifted to 1, and all ERCC transcripts are shown. (e) Pie chart of Ensembl genes (FPKM ≥ 5) with noncoding biotypes from the Simul-seq transcriptome. Misc RNA, miscellaneous RNA; lincRNA, long intergenic noncoding RNA; miRNA, microRNA; snoRNA, small nuceolar RNA; snRNA, small nuclear RNA. (f) Scatter plot of log10(FPKM + 1) values across all genes measured in the Simul-seq or RNA-seq data sets (Spearman's ρ = 0.97).

