Figure 4.
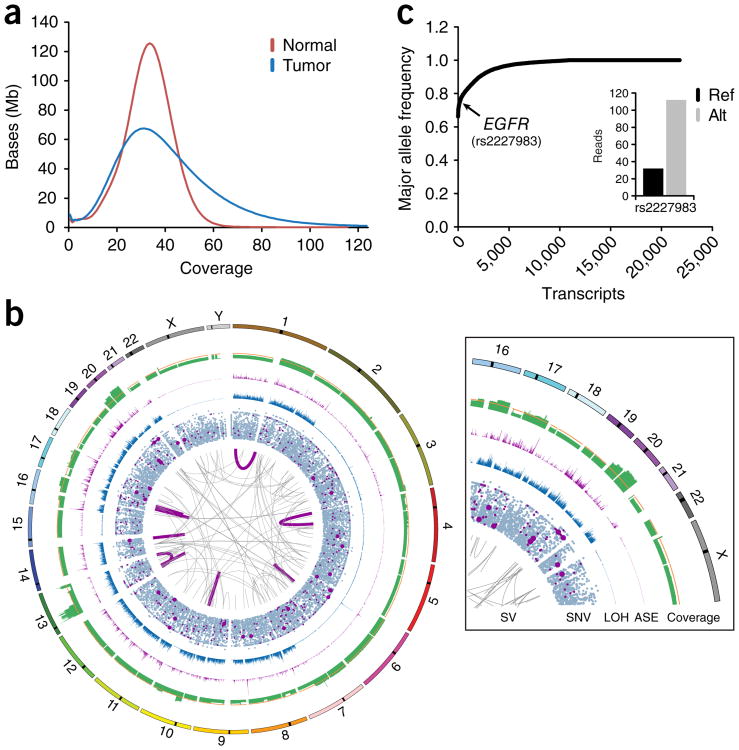
Comprehensive genome and transcriptome profiling of esophageal adenocarcinoma (EAC). (a) Coverage distributions for Simul-seq tumor genome and DNA-seq normal genomes. (b) Circos plot of somatic events in the tumor genome. The innermost ring depicts large structural variants (SVs), with expressed gene fusions highlighted in dark magenta. The second ring is a scatter plot of somatic single-nucleotide variants (SNVs), where an increased radial distance represents an increasing variant allele quality in the tumor genome. Dark magenta data points indicate expressed somatic SNVs, with the radius of expressed, nonsynonymous somatic mutations enlarged. The third ring is a histogram of the total number of heterozygous positions in the normal that are called homozygous in the tumor (LOH) per 100 kb. The fourth ring is a histogram of the number of transcripts exhibiting allele-specific expression (ASE) per 100 kb. The fifth ring corresponds to the normalized average coverage over 100-kb bins, whereas the orange line indicates the genome-wide average coverage. The outermost ring represents chromosome annotations. (c) Scatter plot for the average major allele frequencies for each transcript exhibiting allele-specific expression. Inset depicts reference (ref) and alterative (alt) RNA read counts for a known EGFR polymorphism.

