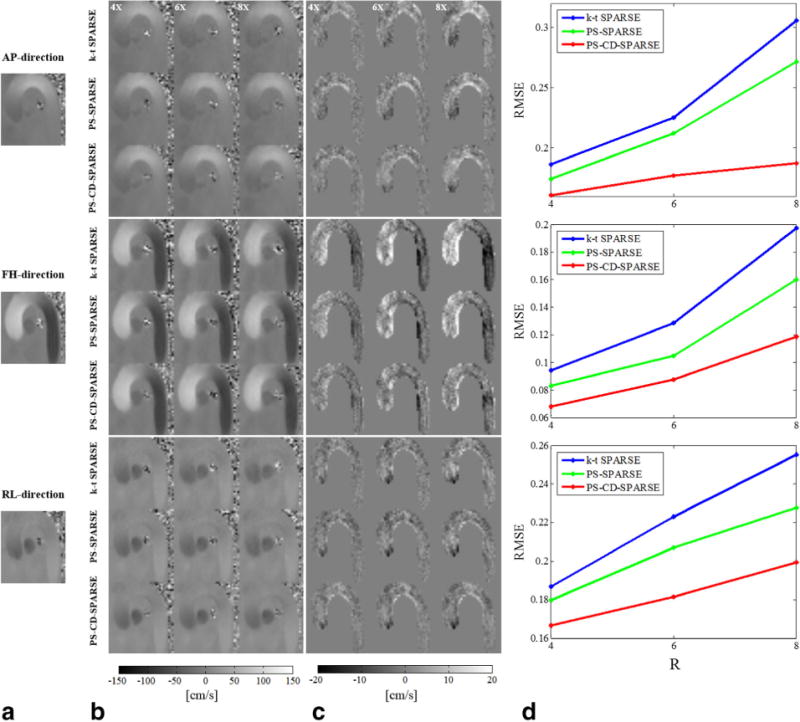
FIG. 3.

Reconstructed velocity maps for a systolic cardiac phase at different acceleration factors. a: Reference from the fully sampled data along the AP, FH, and RL directions. b: The reconstructed velocity maps using k-t SPARSE, PS-SPARSE, and PS-CD-SPARSE at R = 4, 6, 8. c: The associated velocity error maps with the reconstructions in (b) within the masked ROI. d: The RMSEs for each velocity component.
