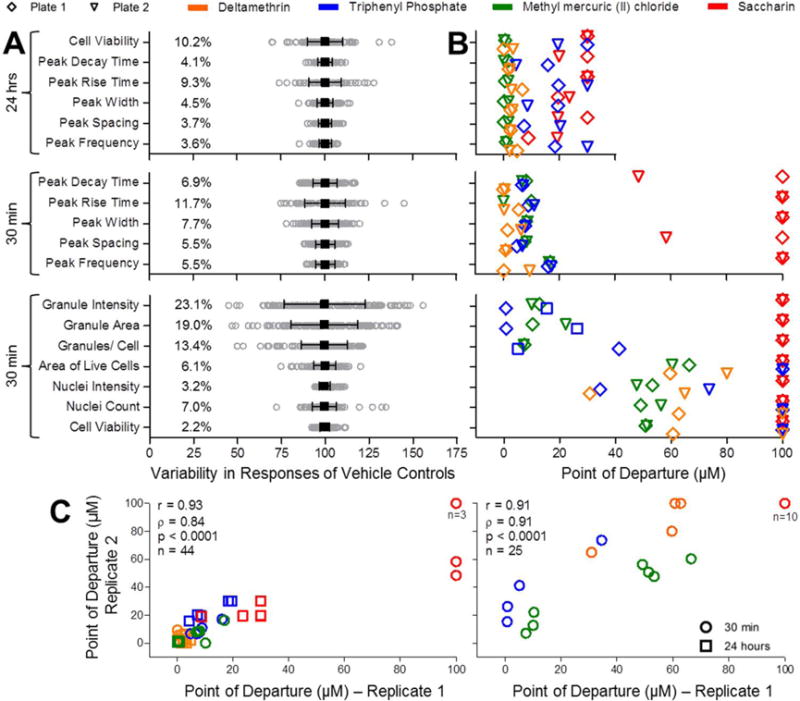
Figure 4.

Quality control of in vitro cardiotoxicity, cell viability, and mitochondrial toxicity assays. (A) Vehicle control (DMSO) variability (n=164 for Cardiophysiology at 30 min; n=116 for Cardiophysiology at 24 hrs; n=144 for Mitochondrial Toxicity). Mean (black square) ± SD (range bars) is shown for each phenotype overlaid on top of gray circles representing individual well responses. Coefficients of variation (%CV) are also shown for each phenotype. (B) Comparison of POD (Point-of-Departure) values from two different assay plates for deltamethrin, triphenyl phosphate, methyl mercuric (II) chloride, and saccharin. Plots indicate replicate PODs for 11 cardiophysiologic (n=44, including cell viability measurements after 24 hours) and 7 cellular and mitochondrial toxicities (n=25, all after 30 min of chemical exposure) phenotypes. Legend for plate and chemical identifiers is shown above the charts. (C) Correlation between inter-plate replicates for the above defined 11 cardiophysiologic (n=44, left) and 7 cellular and mitochondrial (n=25, right) was assessed using Pearson (r) and Spearman (ρ) analysis.
