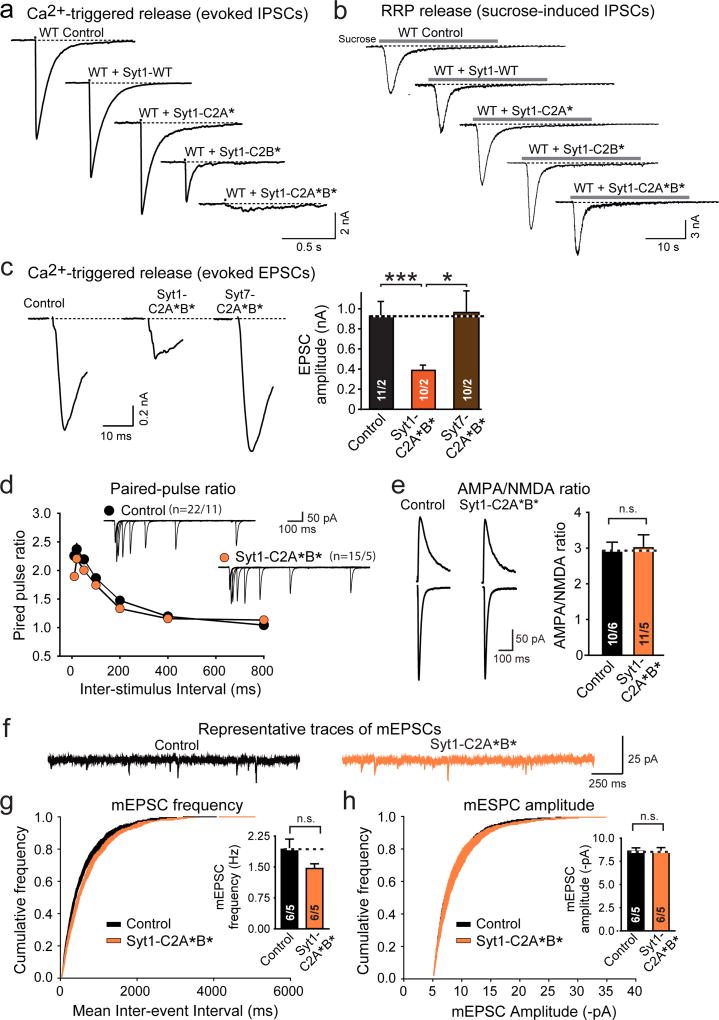
Extended Data Figure 9. Presynaptic and postsynaptic expression of dominant negative Syt1-C2A*B*.
a & b, Action potential-evoked (a) and sucrose-induced IPSCs (b) from cultured hippocampal wild-type neurons infected with control lentiviruses or lentiviruses encoding the indicated Syt1 or Syt7 constructs. In culture, lentiviruses uniformly infect all neurons; thus, recordings reflect conditions in which lentiviruses had infected both pre- and postsynaptic cells.
c, Evoked EPSCs recorded in cultured wild-type neurons that were infected either with a control lentivirus or with lentiviruses encoding the equivalent mutants of Syt1 (Syt1-C2A*B*) or Syt7 (Syt7-C2A*B*). Note that only the Syt1 but not the Syt7 mutant is dominant negative (left, representative traces; right, summary graph of the EPSC amplitude).
d–h, In vivo expression of dominant negative Syt1-C2A*B* in postsynaptic neurons alone does not affect basal transmission. Postsynaptic overexpression of dominant-negative mutant Syt1-C2A*B* in a subset of CA1-region pyramidal neurons by stereotactic injection of lentiviruses does not cause a major change in paired-pulse ratios of AMPAR EPSCs at different inter-stimulus intervals (d), AMPAR/NMDAR-ratio (e), or frequency or amplitude of mEPSCs (f, sample traces; g, cumulative probability plot of the mEPSC inter-event interval with the summary graph of the mean frequency; h, cumulative probability plot of the mEPSC amplitude with the summary graph of the mean amplitude.
All data are means ± SEM; numbers in bars indicate number of neurons/mice analyzed. Statistical significance was assessed by Mann-Whitney U test (*, p<0.05; ***, p<0.001).

