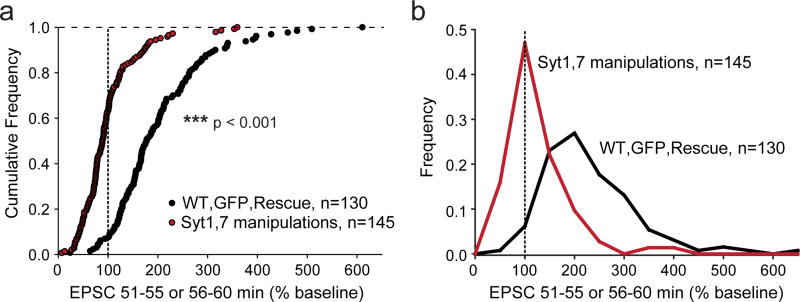
Extended Data Figure 10. Summary graphs of the combined effects of all Syt1,7 loss-of-function manipulations on postsynaptic LTP.
a, Cumulative data for all LTP and voltage-pulse LTP experiments. Control, GFP, and Syt7 rescue experiments are shown in black. Manipulations to both Syt1 and Syt7 by KD and KO as well as Syt1-C2A*B* overexpression experiments are shown in red. Statistical significance was assessed by Mann-Whitney U test (***p < 0.001) comparing test conditions to control. Dotted line represents the 100% mark corresponding to an absence of a change in synaptic strength as a function of LTP induction.
b, Normalized frequency of the same data in a grouped in bins of 50%.

