
Extended Figure 1.
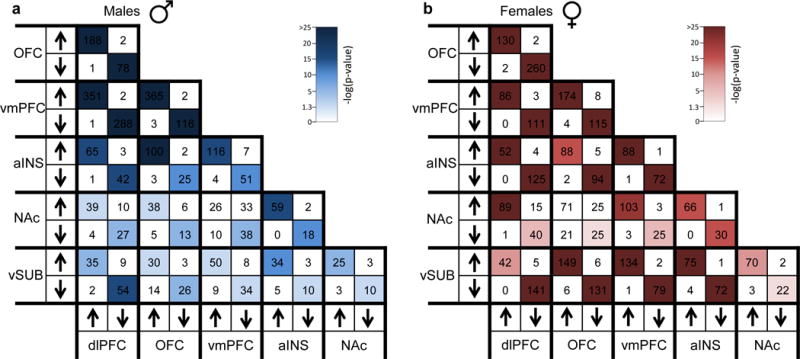
Degree of overlap for genes significantly differentially expressed in a, males with MDD and b, females with MDD across brain regions. Arrows on x and y axis correspond to directionality of gene expression changes across brain regions and numbers within squares highlight the number of overlapping genes. Colors within squares represent the −log(corrected Fisher’s Exact test p value) of the enrichment across brain regions which is depicted in the color key.