
Figure 1.
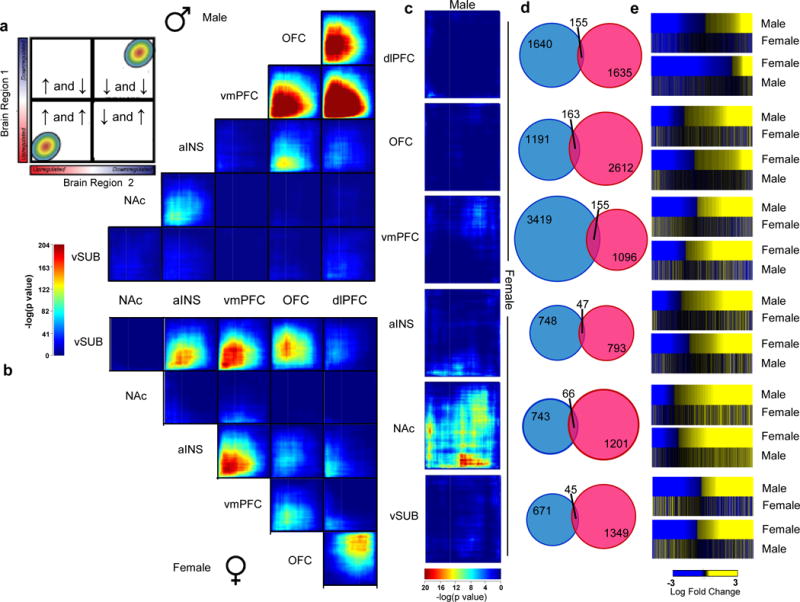
Differential expression profiles in humans with MDD reveal distinct sex-specific transcriptional signatures across brain regions. a,b, Rank-rank hypergeometric overlap (RRHO) maps comparing region to region transcriptional profiles in a, males and b, females with MDD. The upper left panel in a displays the overlap relationship across brain regions. The color bar between a and b represents degree of significance. c, RRHO maps directly comparing male and female transcriptional profiles across brain regions. Degree of significance is depicted in the color bar below the RRHO maps. d, Venn diagrams displaying low overlap between genes differentially expressed (p<0.05) in males (blue) and females (pink) across brain regions. e, Heatmaps comparing transcriptional changes (log fold change; below the heatmaps) in males and females with MDD compared to controls across brain regions.