
Figure 3.
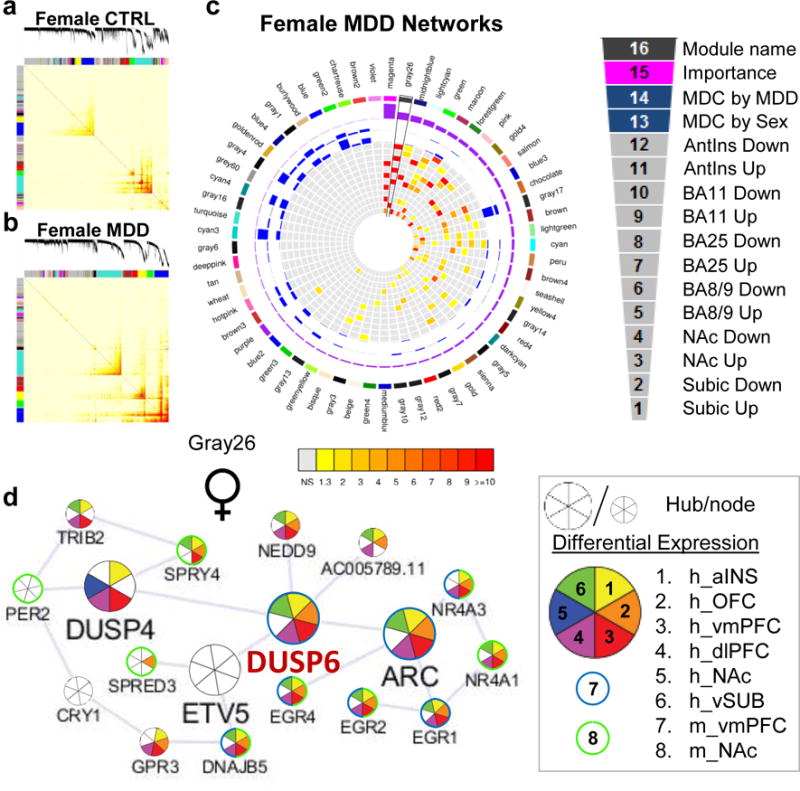
Gene co-expression modules in females with MDD are enriched for DEGs across brain regions. a, Topological overlap matrix (TOM) plots for control and b, MDD modules in females. Light color represents low topological overlap and progressively darker red color represents higher overlap. Each module is assigned by unique color. c, Circos plots displaying the degree of enrichment for DEGs (p<0.05) in female modules. Colors within squares of the plots represent the corrected FET p-value of the enrichment of DEGs across modules which are depicted in the color bar below the circos plot. Legend on the top right corner defines individual layers of the circos plot. d, Gray26 module in female MDD shows enrichment for DEGs across brain regions. Hubs and nodes are defined by the size of the circles with colors representing enrichment for DEGs across brain regions (depicted in the bottom right panel). DUSP6, labelled in red, was selected for sex-specific in vivo functional validation studies.