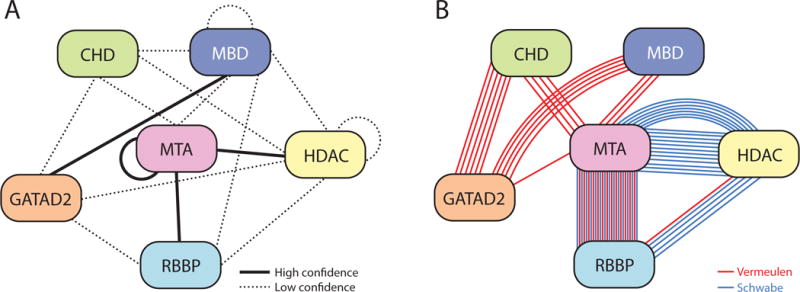
Figure 2. Summary of published interactions and crosslinks between NuRD subunits.

(a) Interactions are classified as “high confidence” (solid line), or “low confidence” (dotted line), according to the criteria in Table 1. (b) Representation of the XL-MS data presented in Table 2, taken from either [40] (red lines) or [19] (blue lines). Proteins are coloured in a similar way to Figure 1.
