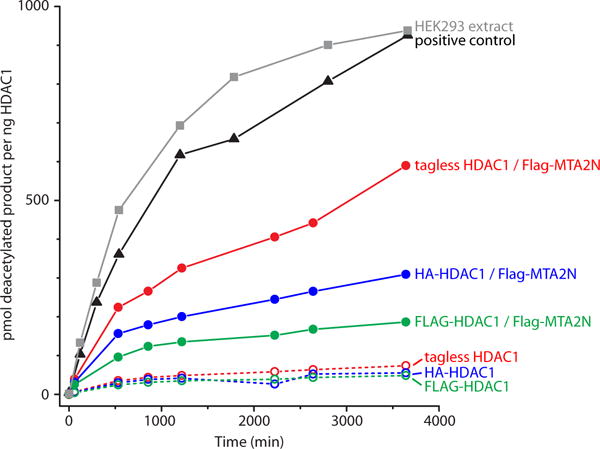
Figure 7. HDAC activity assays show low activity for RRL-produced HDAC1.

Deacetylase activity is shown at eight time points for samples of immunoprecipitated HDAC1 extracted from HEK293 cells (squares, grey), or produced with rabbit reticulocyte lysate (circles). The versions of HDAC1 tested were: tagless (red), HA-tagged (blue) or FLAG-tagged (green), with (filled circles, solid lines) or without (open circles, dashed lines) co-expression of FLAG-MTA2N. The amount of deacetylase activity observed for the HDAC positive control (supplied by the assay kit’s manufacturer) is also shown (triangles, black). Similar and consistent values were obtained for two to three independent experiments performed with separate samples of each protein, but only one is shown here for clarity.
