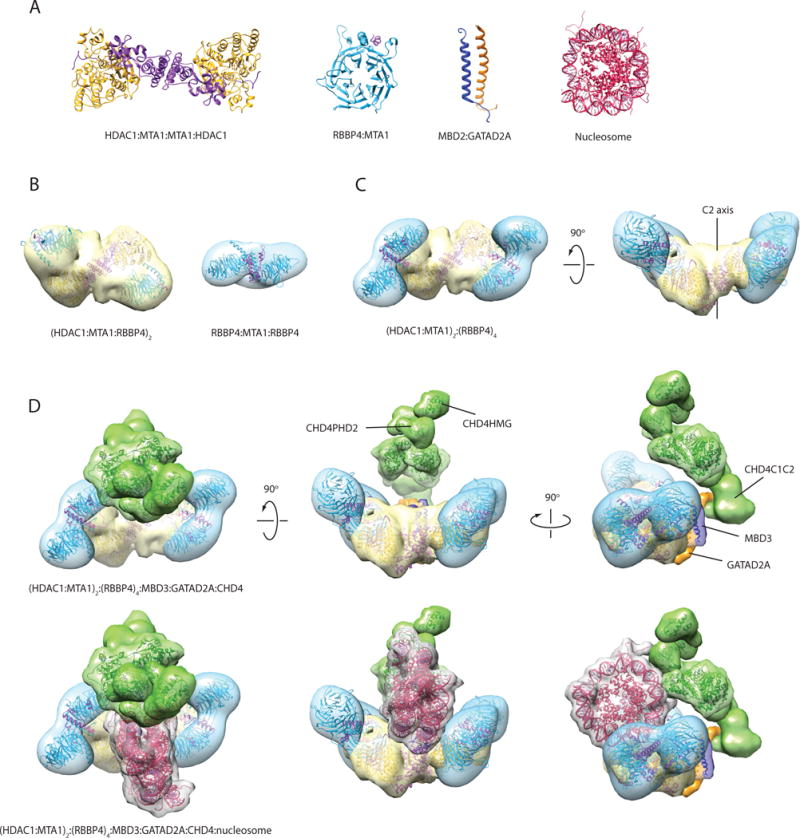
Figure 9. Model of the NuRD complex based on the interaction map and structures of NuRD subcomplexes.

(a) X-ray structure of the HDAC1-MTA1(ELM-SANT) dimer (PDB ID: 4BKX) [15], X-ray structure of RBBP4-MTA1(674–686) (PDB ID: 4PBY) [17], NMR structure of MBD2-GATAD2A coiled-coil (PDB ID: 2L2L) [16], and X-ray structure of the nucleosome (PDB ID: 1EQZ). (b) Single-particle EM envelopes for the (HDAC1-MTA1-RBBP4)2 sub-complex (PDB ID: 5FXY and EMDB ID: EMD-3399) [19] and the MTA1-(RBBP4)2 subcomplex (EMDB ID: EMD-3431) [18]. The structures have been rendered as a reduced resolution envelope by applying a Gaussian filter in Chimera [36]. X-ray crystal structures of HDAC1-MTA1 and RBBP4 have been fitted into the maps using the ‘fit’ function in Chimera. (c) Model of an (HDAC1-MTA1)2-RBBP44 sub-complex generated using two copies of the MTA1-(RBBP4)2 model, and superimposing an RBBP4 subunit from each copy onto each RBBP4 in the (HDAC1-MTA1-RBBP4)2 model. (d) Model of the NuRD complex generated using the subcomplex in (c) and positioning MBD3, GATAD2A and CHD4 in agreement with the observed protein-protein interactions. MBD3 (dark blue) bridges MTA1 and GATAD2A (orange), while GATAD2A contacts the C-terminal third of CHD4 (green). MBD3 is represented by the MBD2:GATAD2A structure and the MBD domain of MBD3 (PDB ID: 2MB7). A density envelope derived from a disordered polypeptide chain was used to depict GATAD2A. CHD4 is represented by the structures of CHD4HMG (PDB ID: 2N5N), CHD4PHD1 (PDB ID: 2L5U), CHD4PHD2 (PDB ID: 1MM2), and the yeast Chd1 chromodomain-ATPase domains (PDB ID: 3MWY); a volume made from two copies of the DNA-binding domain of CHD1 (PDB ID: 4B4C) was used to represent the CHD4C1C2 region. The three bottom views are the same as the top views, with the addition of a manually placed nucleosome (PDB ID: 1AOI). Structures and modelled maps were generated using Chimera. Proteins are coloured as in Figures 1, 2 and 8. It is important to emphasise that, while (a) and (b) show published experimental structures, for (c) and (d) the envelopes shown are hypothetical and built as just described, but not based on novel experimental EM or SAXS data on the respective complexes.
