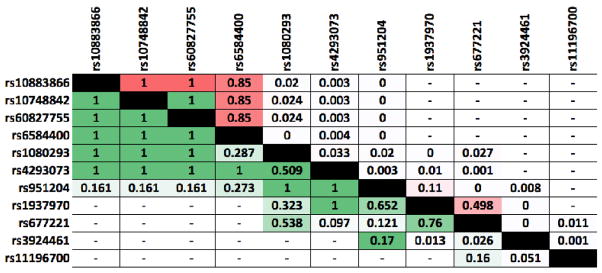
Figure 5.
Linkage Disequilibrium between NRG3 SNPs mentioned in this review and shown in Figure 1. R-squared is above the diagonal and D-prime below, and higher values are highlighted red and green respectively. Dashes indicate no data due to SNP distances >500 Kb

