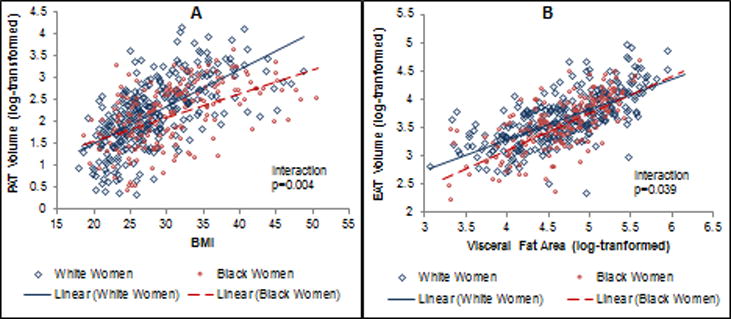
Figure 1. Scatterplots of race-specific slopes of A) BMI on PAT and B) visceral fat on EAT.

A) BMI on PAT volume by race: Every 1-SD higher BMI was associated with 66.7% greater PAT volume in White compared with 42.4% greater PAT volume in Black women (P=0.004); B) Visceral fat on EAT volume by race: Every 1-SD higher visceral fat was associated with 32.3% greater EAT volume in Black compared with 25.3% greater EAT volume in White women (P=0.039). Models were adjusted for age, study site, menopausal status, hypertension, diabetes, alcohol consumption, and physical activity.
