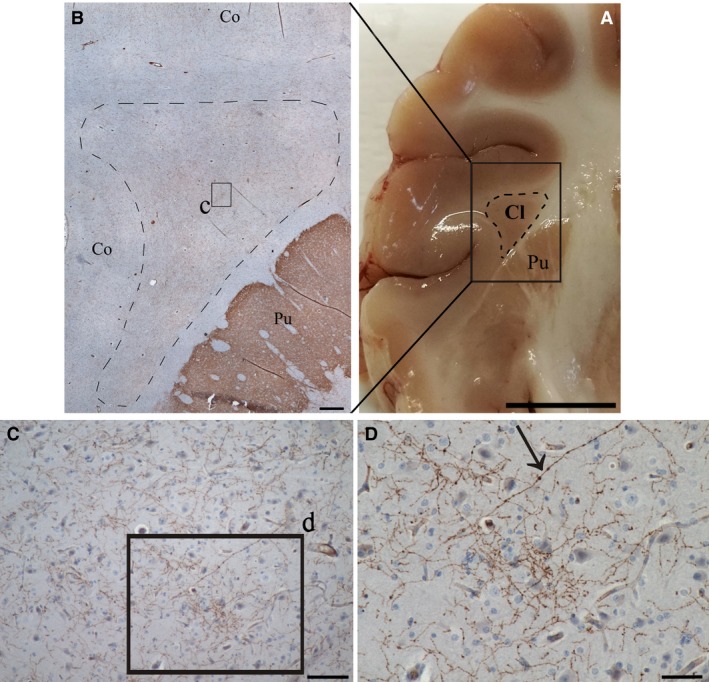
Figure 4.

TH‐labeled fibers in the claustrum and adjacent structures. (A) photograph of a coronal section of the pig brain, black rectangle shows the immunostained area represented in figure B. (B) Low magnification image showing immunostaining in the putamen (Pu), in the claustrum (dashed line, Cl) and cortex (Co). (C) Higher magnification of the zone indicated with the black square (c) in image B. (D) Higher magnification of a part (d, black square) of image C, arrow indicates a thick TH fiber with round varicosities. Scale bars = 500 μm (A), 100 μm (B), 50 μm (C), 1 cm (D).
