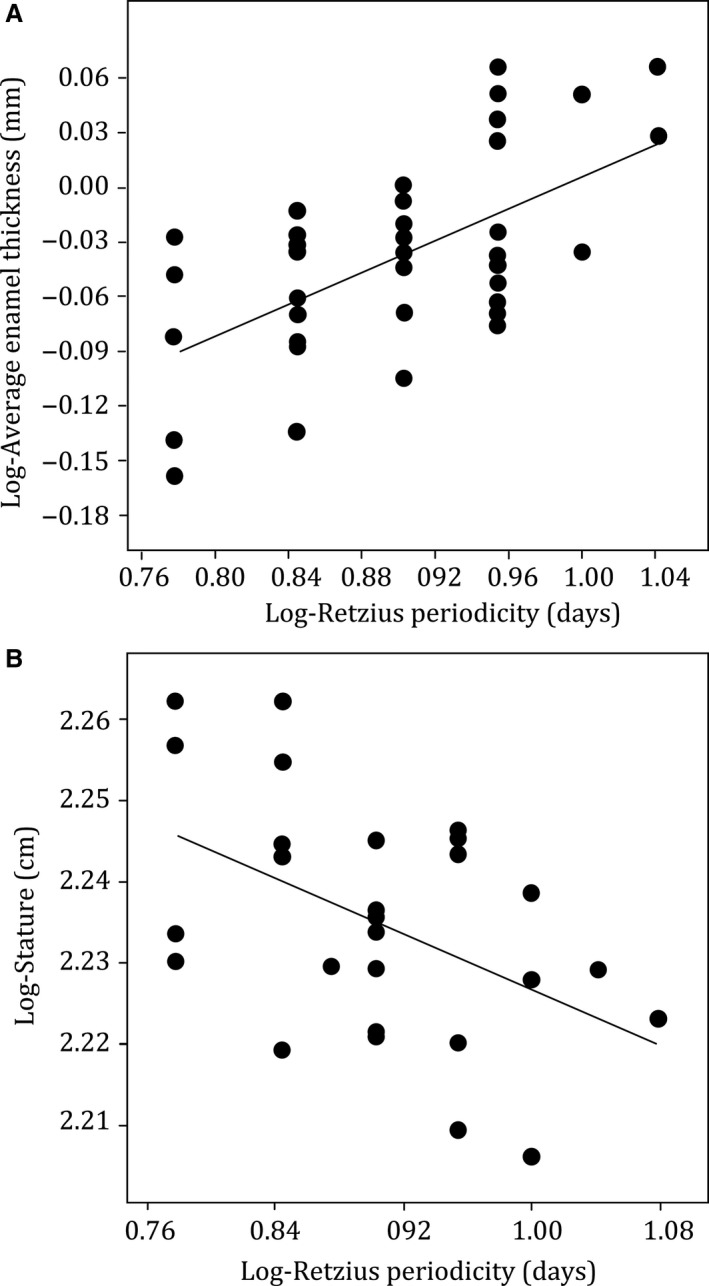
Figure 3.

Plot of log‐Retzius line periodicity (RP) against log‐average enamel thickness (AET) for all molar types combined n = 40 (A) and the stature of young males n = 27 (B). Regression lines are fitted to the data. Regression statistics are shown in Table 1. Corresponding data sets are available in Supporting Information.
