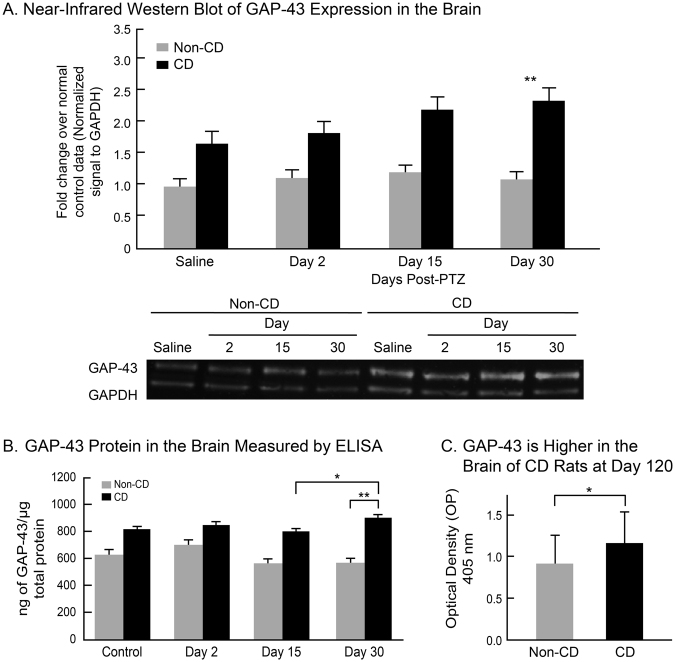
Figure 3.
Quantified GAP-43 protein expression in the brain. (A) Near-infrared (NIF) western blots normalized to GAPDH show GAP-43 protein in CD and non-CD brains at each time point after PTZ induced seizures. Western blot image was cropped to remove protein ladder. (B) GAP-43 protein in the brain as measured by ELISA in CD rats compared to non-CD rats at each time point. (C) ELISA results show a higher level of GAP-43 protein in CD rats as compared to non-CD rats 120 days after PTZ induced acute seizures. Error bars represent standard error of the mean. Sample sizes: Non-CD + Saline n = 5, + PTZ Day 2 n = 4, + PTZ Day 15 n = 4, + PTZ Day 30 n = 4. CD + Saline n = 4, + PTZ Day 2 n = 4, + PTZ Day 15 n = 4, + PTZ Day 30 n = 4.

