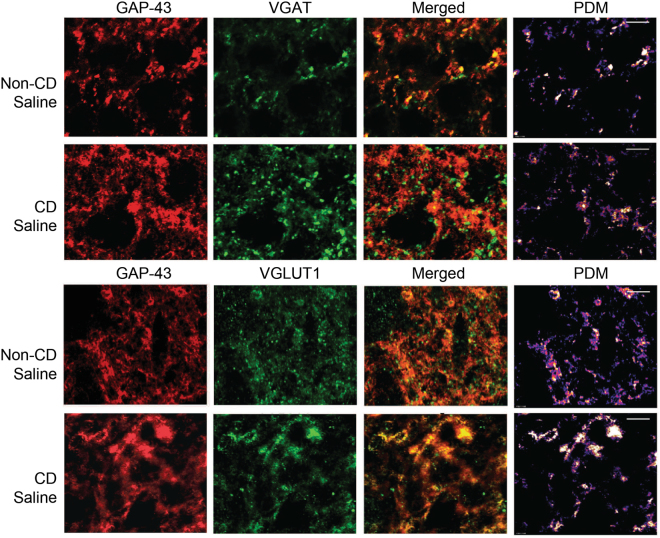
Figure 5.
Co-localization of GAP-43 with presynaptic markers of inhibition and excitation. Confocal images of cortical tissue stained for GAP-43 (red) with VGAT (green; top) and VGLUT1 (green; bottom). Product of the Differences from the Mean (PDM) images show areas where both images express co-localization with pixels above the mean intensity. PDM = (red intensity - mean red intensity) × (green intensity - mean green intensity) as described in Li et al. 2004. Scale bar = 5 μm. Sample sizes: non-CD n = 4, CD n = 4.

