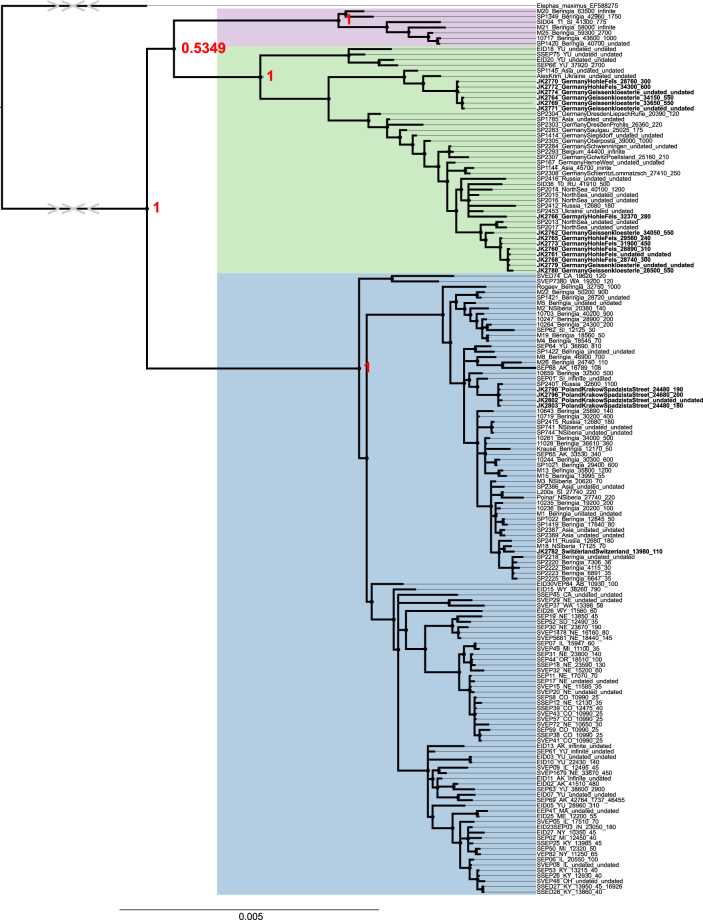
Figure 1.
Bayesian phylogenetic tree of all previously published woolly mammoth mammoths mitochondrial genomes3–5,25–27 and 20 mitochondrial genomes presented here (in bold). Node values represent posterior probability values from 100,000,000 steps for the bayesian tree. For visibility reasons, only support values related to the relationship of the three clades are shown. Clades are indicated by the following colours: Blue - I; Purple - II; Green - III. Radiocarbon dates in sample names are uncalibrated. The full tree as well as Neighbour-Joining, Maximum Parsimony and Likelihood trees can be found in Supplementary Figures S4–S7. Trees were generated using Figtree (tree.bio.ed.ac.uk/software/figtree/) and modified in Inkscape (inkscape.org).

