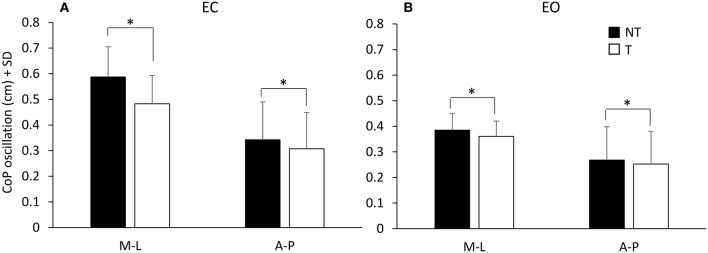
Figure 2.
Mean values of CoP oscillations at steady-state under EC (A) and EO (B) condition. Black bars refer to no-touch (NT) condition, white bars to touch (T) condition. The CoP oscillations were greater along the frontal (M-L) than the sagittal (A-P) plane and greater under EC than EO condition. CoP oscillations were greater during the NT condition than during T condition. *Indicates a significant difference (p < 0.05).

