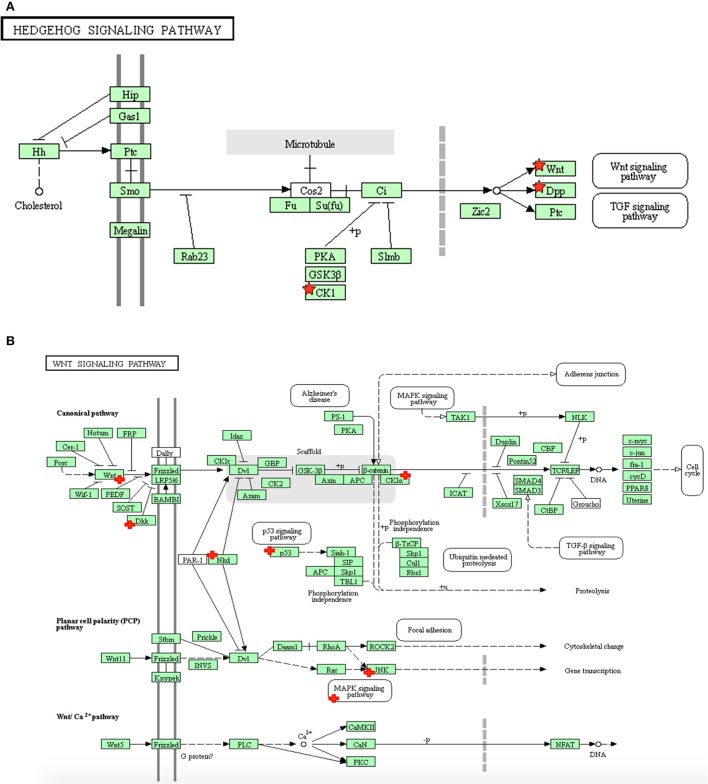
Figure 2.
The distribution of differentially expressed genes in astrocytes following hypoxia+ hypothermia vs. hypoxia: (A) Within the Hedgehog signaling pathway, (B) Within the Wnt signaling pathway in primary human cortical astrocytes being cultured under hypoxic conditions (5% O2) for 6 h with or without hypothermic intervention (32°C after 2 h; maintaining hypoxia for 6 h) (adapted from KEGG website: www.genome.jp/kegg). The significant up- and down-regulated genes, indicated with red + signs, were identified using DAVID/KEGG enrichment analysis of microarray data (n = 2).

