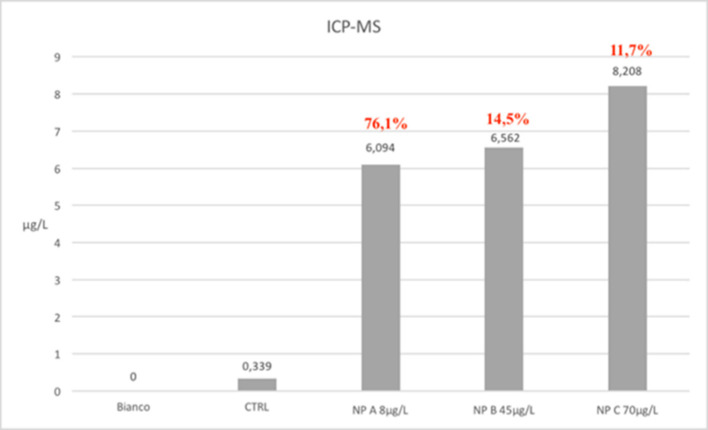
Figure 9.
Graphic results of ICP-MS analysis. The ICP-MS analysis infact shows that the amount of particles absorbed in all treated samples is almost the same. Total silver concentrations found vary from a minimum of 6 mg/l in NPa group samples to 8.2 mg/l in those belong to NPc group. The rate of absorption was respectively of 76.1% (NPa), 14.5% (NPb), and 11.7% (NPc), demonstrating a greater capacity of assimilation of the particles in mono-dispersed phase.

