Figure 1.

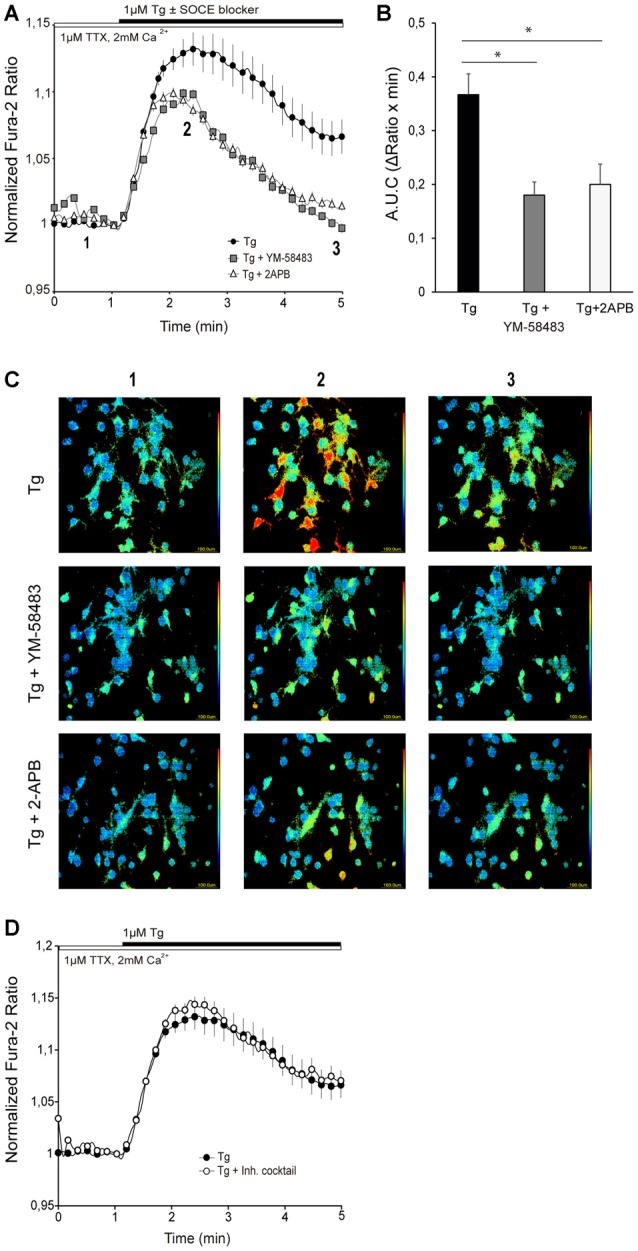
Store-operated calcium entry (SOCE) activity in primary cortical neurons. (A) Fura-2 [Ca2+]i signals in cortical neurons in HCSS medium containing 2 mM CaCl2 and 1 μM tetrodotoxin (TTX), upon addition of 1 μM thapsigargin (Tg) ± 10 μM YM-58483 or 50 μM (2-Aminoethoxydiphenyl borate (2-APB) were indicated. The numbers refer to the frames reported in the (C). (B) Quantification of area under SOCE curve (A.U.C, ΔRatio·min). Data were obtained from three independent experiments (n = 3), and in each one a total of 25–30 cells were analyzed. (C) Representative color-coded Fura-2 [Ca2+]i ratio images from basal situation (1), immediately after Tg ± SOCE blockers addition (2), and the end of the measurement. Pseudo-color ratio images were obtained using Aquacosmos 2.5 software (Hamamatsu). (D) Fura-2 [Ca2+]i signals in cortical neurons in HCSS medium containing 2 mM CaCl2 and 1 μM TTX ± inhibitory cocktail (10 μM CNQX (6-cyano-7-nitroquinoxaline-2,3-dione), 10 μM MK-801, 5 μM MPEP, 50 μM NiCl2), upon addition of 1 μM Tg. Data were obtained from three independent experiments (n = 3), and in each one a total of 25–30 cells were analyzed. All data are normalized to the initial values and are expressed as mean ± SEM. Means were compared using one-way ANOVA, *p < 0.05, post hoc Bonferroni test.
