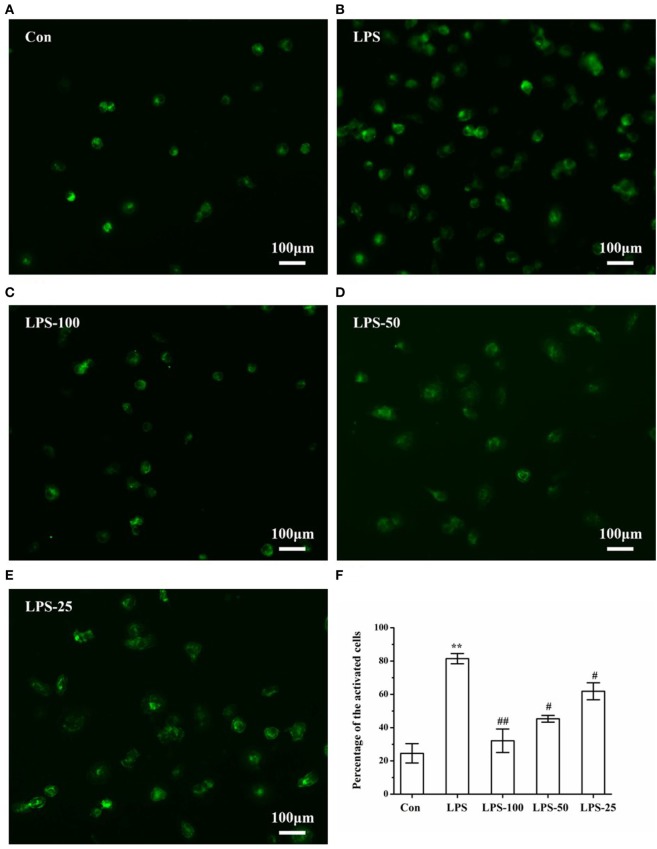
Figure 9.
Immunofluorescence images of LPS-induced microglia after α-asarone treatment. Representative images of primary rat microglia cells in the Con group, LPS group, the LPS-100 group, the LPS-50 group, the LPS-25 group (A–E). Cells were pretreated with α-asarone at described concentrations for 1 h. Then, LPS was added to each plate and incubated at 37°C for an additional 3 h. Quantitative analysis of the percentage of activated microglia (F). Con, control group; LPS, lipopolysaccharide-treated model group; LPS-100, LPS-50, LPS-25, microglial pretreatment with different concentrations of α-asarone before LPS treatment (100, 50, 25 µg/ml) group. Scale bar = 100 µm. x ± s. *p < 0.05, **p < 0.01, vs. Con group, #p < 0.05, ##p < 0.01, vs. LPS group.

