Fig. 3.
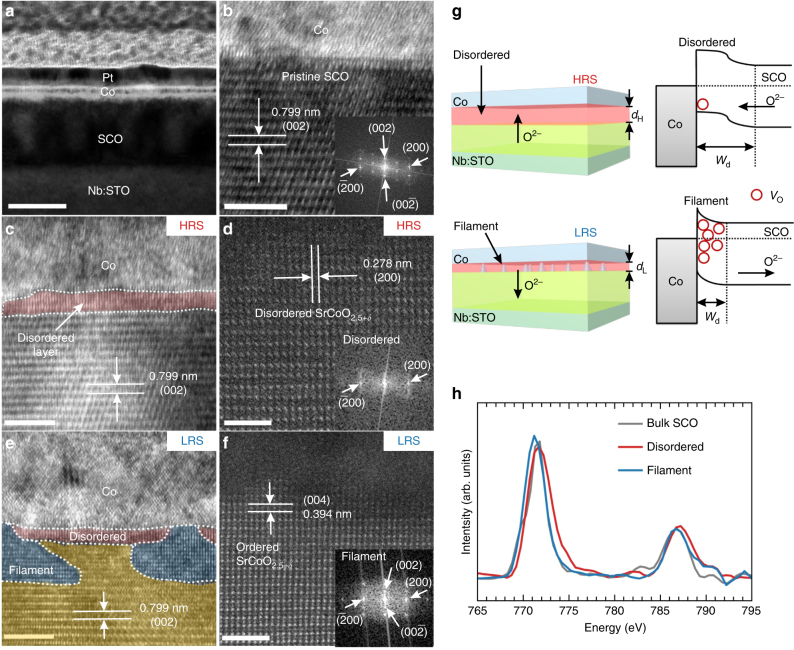
Oxygen ion evolution at Co/SrCoO2.5 interfaces. a Cross-section low-resolution TEM image of the device structure, in which the scale bar is 50 nm. HRTEM image of Co/SrCoO2.5 heterointerface at (b) the pristine state and (c) the high-resistance state. The disordered SrCoO2.5+δ region could be clearly identified as compared with the pristine state, as shown in the magnified image (d). e HRTEM image of the Co/SrCoO2.5 interface in the low-resistance state with the observation of conducting filaments (highlighted by the blue areas). The red and yellow areas denote the remaining disordered and pristine regions, respectively. f Detailed crystalline structure at the conducting filament, which are composed of ordered SrCoO2.5−δ with pronounced oxygen vacancies (VO). The insets of (b), (d), and (f) show the diffraction patterns obtained by local FFT. g Schematic diagram of the oxygen ion evolution with the corresponding band alignments at the heterointerface. h Comparison of Co L-edge EELS spectra of the disordered area and the conducting filament at the interface, as well as the bulk region of the SrCoO2.5 layer. The L3 peak values of the filaments, pristine and disordered regions are 771.2, 771.5, and 771.7 eV, respectively. The scale bar indicates 5 nm in (b), (c) and (e) and 2 nm in (d) and (f)

