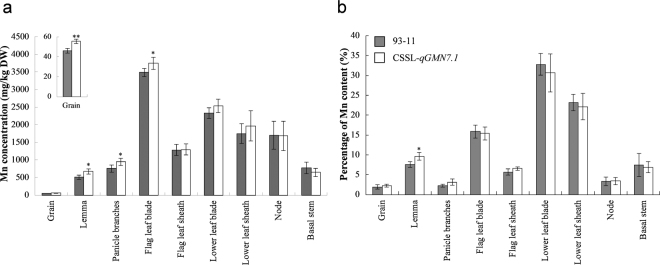
Figure 3.
Mn distribution in the aboveground tissues of 93–11 and CSSL-qGMN7. (a) Mn concentration in different organs. (b) Proportion of Mn content in different organs to the Mn content in the whole plant (except roots). The aboveground tissues of 93–11 (grey) and CSSL-qGMN7.1 (white) grown in the paddy field were harvested and separated into different organs at maturity. Vertical bars represent the standard deviation (n = 4). *and **indicate a 5% and 1% significance level, respectively, according to the t test.

