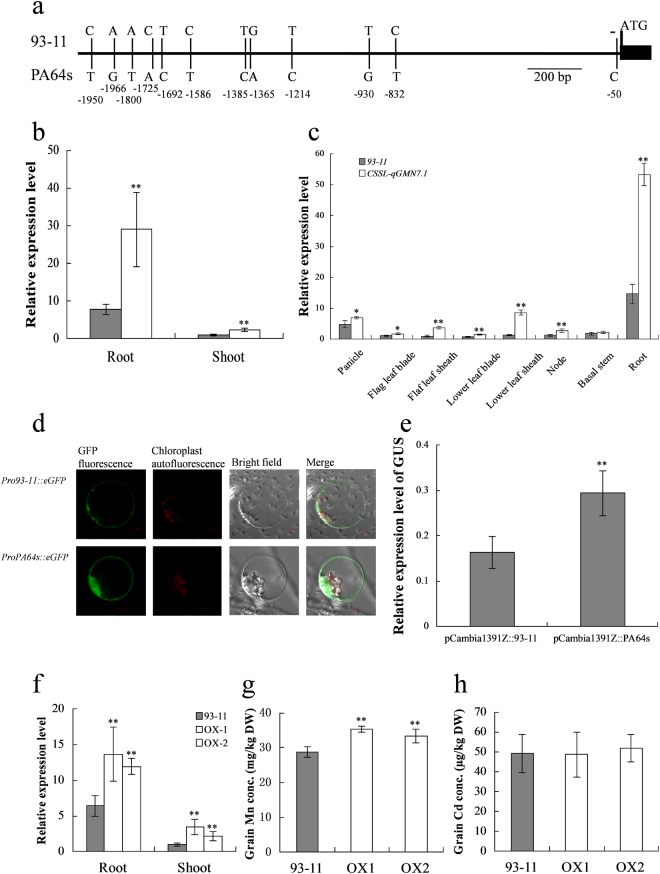
Figure 6.
Validation of candidate gene. (a) Sequence variations in the promoter region of OsNRAMP5 between two parents. (b,c) Comparison of the relative expression level of OsNRAMP5 between 93–11 (grey) and CSSL-qGMN7.1 (white) in roots and shoots at the seedling stage (b), and in different organs at the booting stage (c). (d,e) Promoter activity analysis. The green fluorescent signals of GFP driven by the OsNRAMP5 promoter from 93–11 and PA64s (d), the relative expression level of GUS driven by the OsNRAMP5 promoters from 93–11 and PA64s (e). (f–h) Relative expression level of OsNRAMP5 and grain Mn and Cd concentrations in 93–11 and the overexpression (OX) lines grown in pots. *and **indicate a 5% and 1% significance level, respectively, according to the t test.

