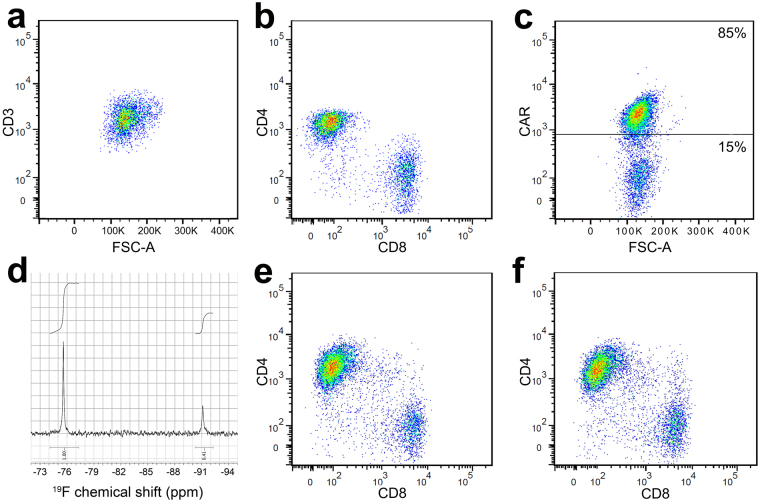
Figure 1.
CAR T cell transduction and characterization. (a) Scatter plot showing the pure population of human T cells (CD3) after magnetic assisted cell sorting of blood samples. (b) Isolated T cell flow analysis for expression of CD4/CD8 shows that 2/3 of T cells are CD4+ and 1/3 are CD8+. (c) CAR T cell population 2 weeks after transduction shows 85% CAR-expressing T cells. (d) 19F NMR spectrum showing PFC uptake of CAR T cells (peak at −91 ppm, 2 × 10¹¹ atoms/cell) normalized to the TFA reference (peak at −76 ppm). (e) Flow cytometry histogram showing similar repartition of CD4+ and CD8+ CAR T cells after transduction compared to untransduced T cells (b). (f) CAR T cells labeled with PFC ex vivo exhibit comparable phenotype to unlabeled cells.

