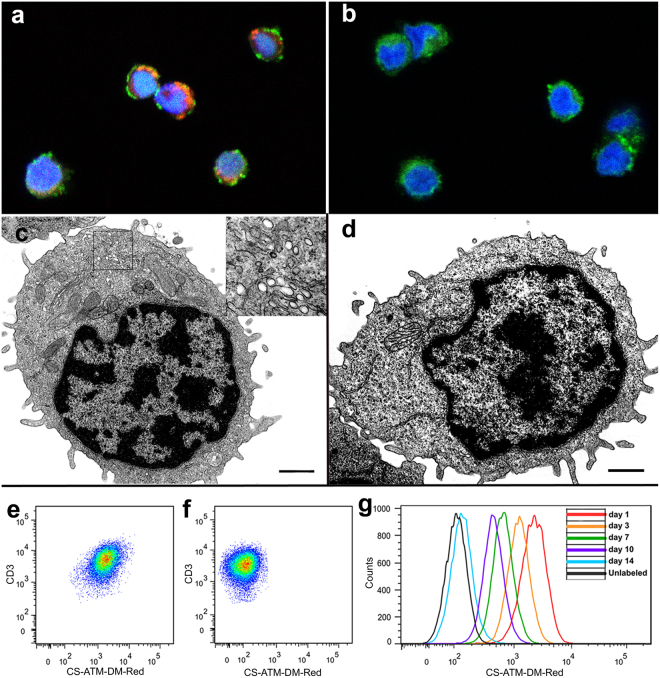
Figure 2.
Confirmation of intracellular localization of PFC. (a) Confocal image (×63) showing perinuclear localization of dual-mode PFC nanoemulsion (in red) in CAR T cells. Nucleus is stained in blue and cell membrane in green via CD3-FITC (b) Control unlabeled CAR T cells do not exhibit red fluorescence. (c) Electron microscopy (EM) micrograph of ultra-thin PFC-labeled CAR T cells reveals the presence of bright vesicles (inset = ×11,000) corresponding to internalized PFC droplets. (d) In control unlabeled cells, no PFC vesicles are found (×4800, scale bars = 1 μm). (e) Flow cytometry scatter plot showing the resulting shift in red fluorescence of CAR T cells after labeling. All cells are labeled after overnight incubation as evidenced by fluorescence gap between labeled (e) and unlabeled (f) CAR T cells. (g) Longitudinal red fluorescence measurement after labeling shows persistent signal and consistent decrease of fluorescence intensity due to cell division.

