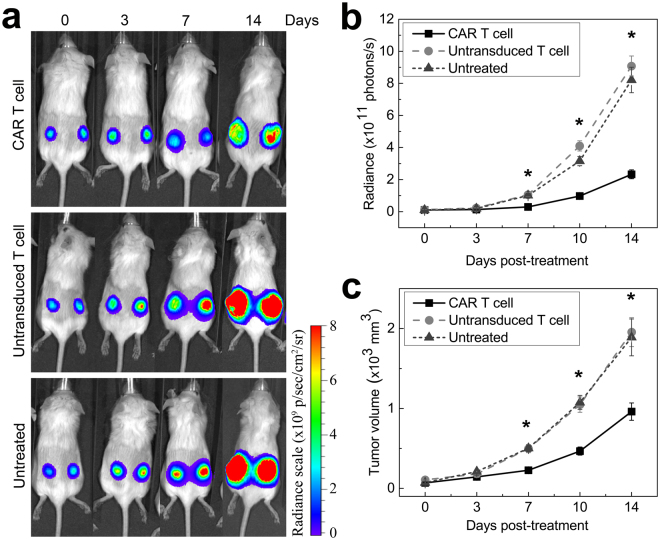
Figure 4.
Impact of cell therapy on tumor growth in vivo. (a) Representative bioluminescence images at day 0, 3, 7, 10 and 14 after cell therapy for all three groups show tumor growth reduction for the CAR T cell treated mice compared to untransduced T cell treated or untreated mice. (b) Bioluminescence signal is significantly lower in the CAR T cell treated group starting at day 7 compared to controls. CAR T cell treated animals display a radiance four times lower than untransduced T cell treated animals or untreated animals at day 14 (*indicates p < 0.0003 at day 7, 10 and 14). (c) Corresponding tumor volume measurements show 50% reduction in tumor growth for the CAR T cell treated group at day 7, 10 and 14 (*indicates p < 0.0003) and no significant difference between untransduced T cell treated and untreated groups (p = 0.38).

