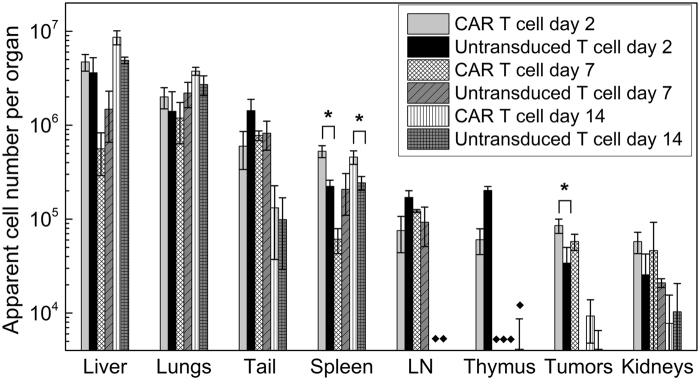
Figure 5.
Biodistribution of tissue samples by 19F NMR at 2, 7 and 14 days post-treatment. 19F NMR measurements of organ biodistribution of the PFC-labeled cells show greater CAR T cell homing to the spleen and tumors compared to untransduced T cells at day 2. The liver signal likely represents the dead T cell fraction. These measurements do not account for cell division, thus referred to as ‘apparent’ cell number. LN indicates lymph nodes, (*) indicate significance, and (♦) indicate pooled samples.

