Figure 6.
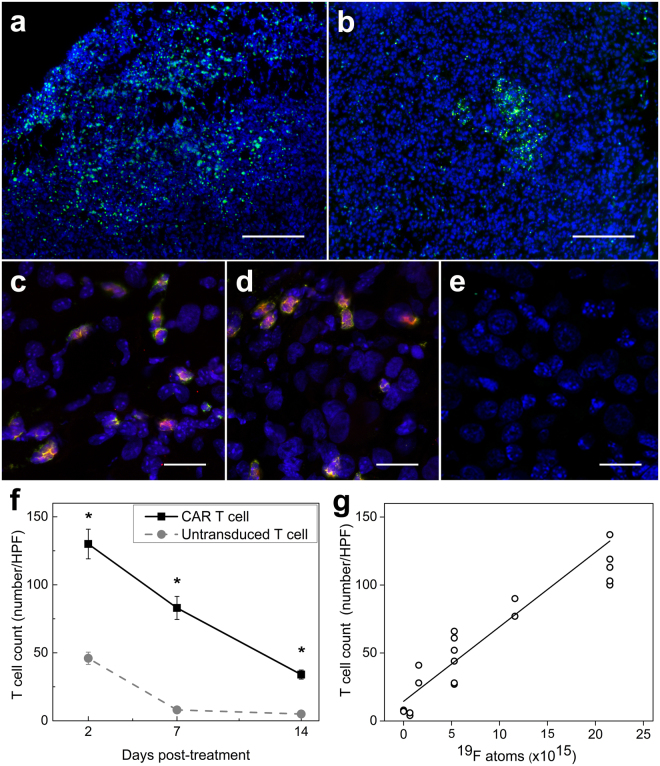
Histological correlation of tumor tissue of T cell treated SCID mice. (a) Low magnification (×5) fluorescent image of the tumor tissue displays prominent CD3 + CAR T cell infiltrates (green). (b) Conversely, sparse untransduced T cells localize to the tumor (scale bars = 100 μm). (c). Confocal images (×63) show that dual-mode PFC nanoemulsion (red) remains colocalized within CAR T cells (green, c) and untransduced T cells (d) at day 2 after infusion. (e) Untreated mice do not exhibit green or red fluorescence due to absence of treatment and endogenous T cells in SCID mice (scale bars = 25 μm). (f) Histological T cell count in high power fields of tumor sections shows greater CAR T cell numbers at all time points compared to sections from untransduced T cell-treated animals (*indicates p < 0.001). (g) Plot showing strong positive correlation (r = 0.89) between average 19F atoms in tumors as measured by NMR and T cell count (N = 120, HPF = high power fields).

