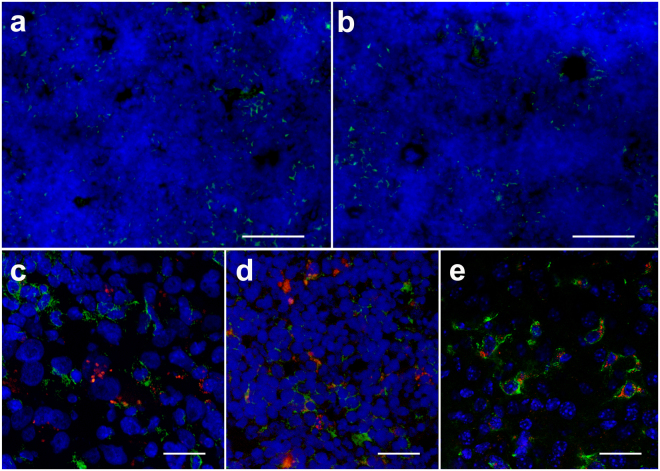
Figure 7.
Histology in spleen and liver tissue of T cell treated SCID mice. (a) Low magnification (×5) fluorescent image of the spleen tissue displays prominent CD3 + CAR T cell infiltrates (green). (b) Untransduced T cells also localize to the spleen (scale bars = 50 μm). (c). Confocal images (×63) show that dual-mode PFC nanoemulsion (red) does not colocalize within phagocytic cells (F4/80 staining, green) in the tumor (c) and spleen (d) at day 2 after infusion. (e) Conversely, F4/80 staining in the liver tissue displays dual-mode PFC (red) colocalizing with Kupffer cells or liver macrophages (scale bars = 25 μm).

