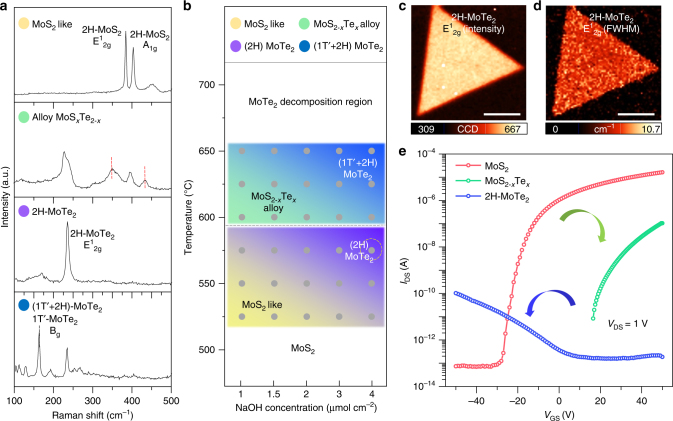
Fig. 5.
Phase modulation with NaOH concentration and temperature. a Raman spectra of representative MoS2−xTex phases with an excitation wavelength of 532 nm. b Phase modulation of MoS2−xTex identified from Raman spectra and optical images. c, d Confocal Raman mapping images for the intensity (c) and FWHM (d) of fully converted 2H-MoTe2; scale bars, 10 μm. e Electrical transport characteristics of pristine MoS2, MoS2−xTex, and 2H-MoTe2. The threshold voltage in the MoSxTe2−x alloy (red) is shifted positively from pristine MoS2 (green). The p-type behavior is shown for 2H-MoTe2 (blue)

