Fig. 6.
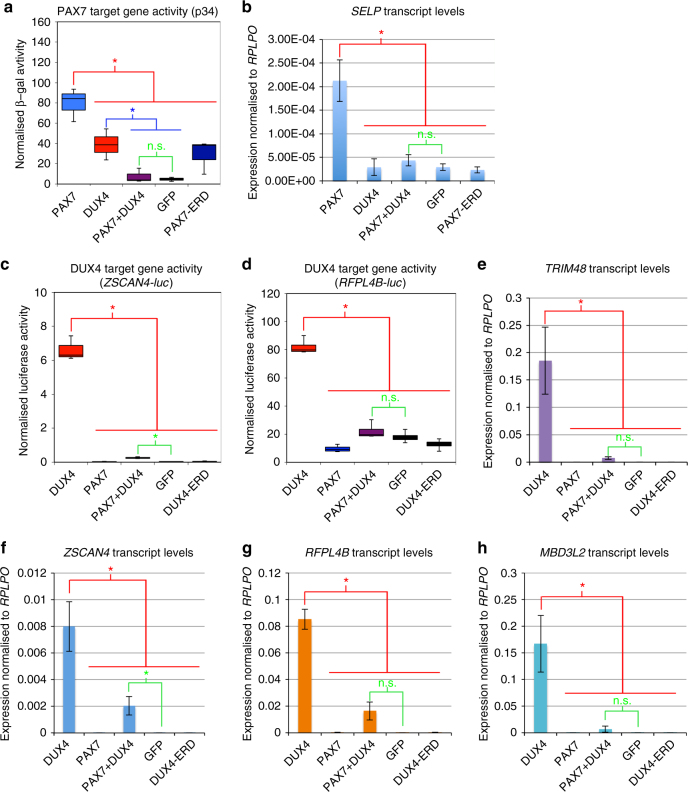
Co-expression of PAX7 and DUX4 causes suppression of the transcriptional activity of both proteins. HEK-293 or NIH-3T3 cells were transfected with plasmids encoding DUX4, Pax7, DUX4 and Pax7, or dominant negative-version DUX4-ERD, or Pax7-ERD. a The ability of PAX7 to activate its transcriptional target genes was measured via the p34 plasmid driving lacZ, co-transfected with the constructs listed above, together with a control RSV luciferase plasmid as a transfection normaliser, into NIH-3T3 cells. Reporter gene intensities were measured using a Glomax-Multi + plate reader and normalised to RSV luciferase. PAX7 activated the p34 PAX7 reporter construct, but both PAX7 and DUX4 together suppressed activity of this PAX7 reporter compared to PAX7 alone. b RT-qPCR for PAX7 transcriptional target gene SELP confirms that co-expression of Pax7 and DUX4 suppresses the activation of this endogenous PAX7 transcriptional target compared to PAX7 alone, in HEK-293. The ability of DUX4 to activate its transcriptional target genes was measured via two separate DUX4 reporter constructs: c ZSCAN4-luc and d RFPL4B-luc, both controlling a luciferase reporter gene, co-transfected with DUX4 and/or Pax7 constructs, or DUX4-ERD or GFP, together with a RSV lacZ as a transfection normaliser, into HEK-293. Reporter gene intensities were measured using a Glomax-Multi + plate reader and normalised to β-galactosidase activity. While DUX4 activated both DUX4 reporters, both PAX7 and DUX4 together, suppressed activity of these DUX4 reporters compared to DUX4 alone. RT-qPCR for DUX4 endogenous transcriptional target genes. e TRIM48, f ZSCAN4, g RFPL4B and h MBD3L2 confirms that the presence of both PAX7 and DUX4 together suppresses activation of all these endogenous DUX4 transcriptional target genes compared to the levels achieved by DUX4 alone in HEK-293 cells. Boxes represents the interquartile range (IQR), with the median indicated by a line. Whiskers denote min (1.5*IQR, max (observed value)). For bar graphs, error bars denote standard error of the mean, n = 3 or 4 for each cell line, ANOVA revealed significant intensity differences, post hoc unpaired two tailed t-tests were employed to assess significant pairwise differences: *denotes p < 0.05, and n.s. denotes non-significance of pairwise t-tests

