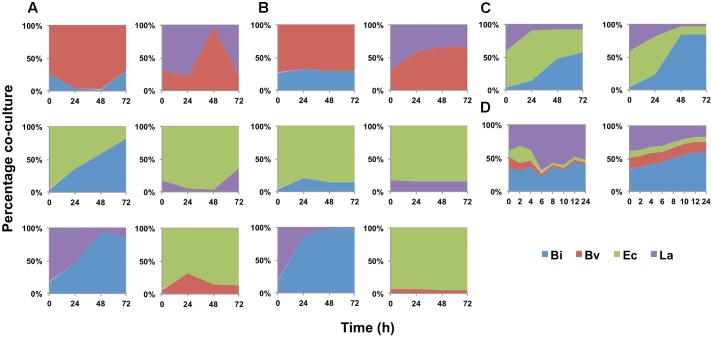
FIGURE 2.
Changes in bacterial population during growth on FOS, expressed as percentage of the co-culture in time. (A) experimental data of co-cultures; (B) model estimation of abundance in co-cultures; (C) abundance of the four-species co-culture in microplates, experimental (Left) and estimated by the model (Right); (D) abundance in the four-species co-culture in the bioreactor during growth on FOS, experimental (Left) and estimated by the model (Right).

