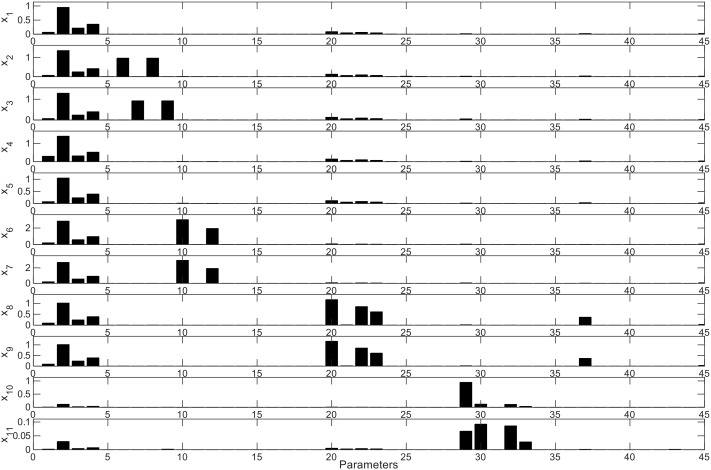
FIGURE 8.
Model parameter average sensitivity. Sensitivity (Y-axis) of each parameter (X-axis) for every ODE is shown. xi represents every ODE described in the model (x1 = dS/dt, x2 = dA/dt, x3 = dL/dt, x4 = dX1/dt, x5 = dX1m/dt, x6 = dX2/dt, x7 = dX2m/dt, x8 = dX3/dt, x9 = dX3m/dt, x10 = dX4/dt, x11 = dX4m/dt), where S: substrate; A: acetate; L: lactate. X: live biomass; Xm: total biomass. Parameters are in the same order in Figure 6.

