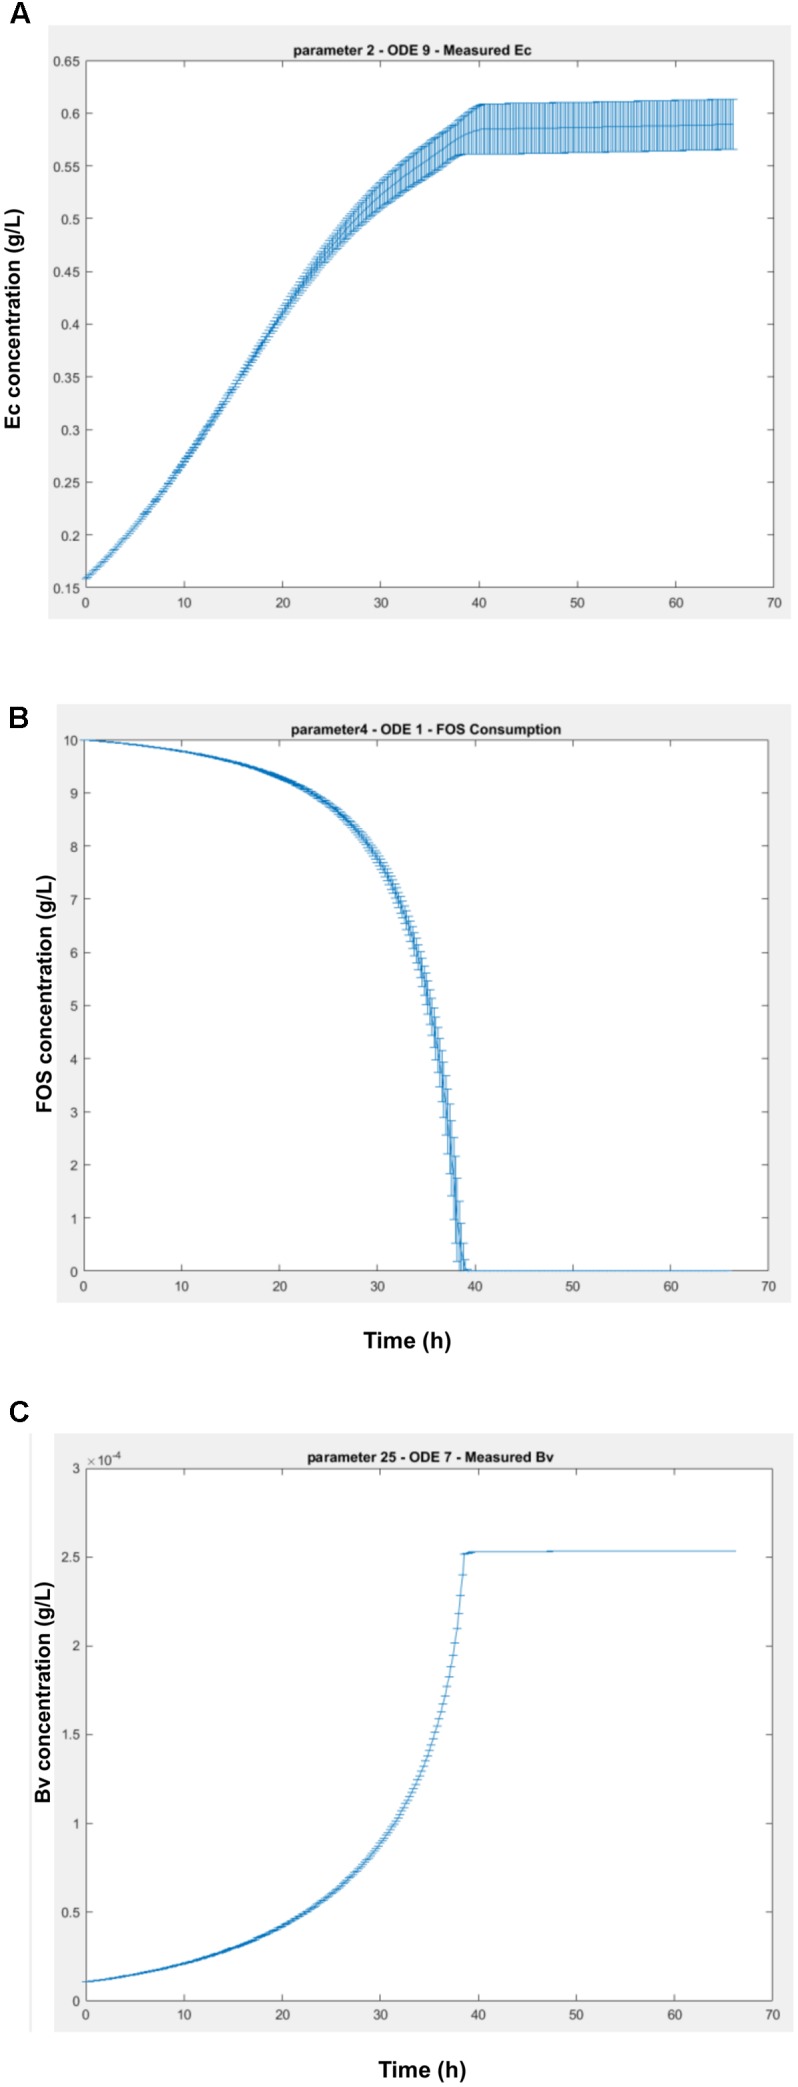
FIGURE 9.

Variation of the ODEs values (g/L) over time due a 5% change in the parameters in 5000 iterations. (A) worst case scenario, with parameter 2 (Bi’s μmax) affecting measured Ec ODE; (B) a change in kinetics scenario, with parameter 4 (Bi’s lactate inhibition constant), affecting FOS consumption; (C) a non-sensitive parameter (measured Bv ODE), for example to Ec substrate yield.
