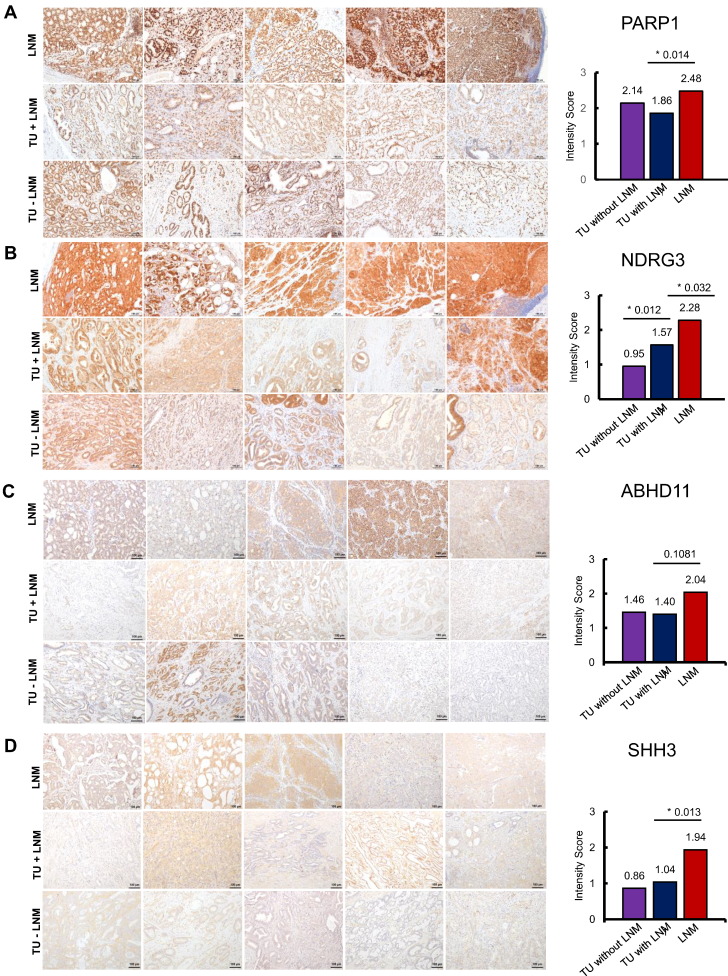
Figure 4.
IHC stainings for (A) PARP1, (B) NDRG3 (C) ABHD11, (D) SSH3, and (E) RDH11 in recurrent LNM, TU with LNM, and TU without LNM, respectively. Staining intensity was evaluated manually and scored as follows: 0 = negative, 1 = weak, 2 = moderate, or 3 = strong. The average intensity scores for each group are plotted in the bar charts on the right side. Statistically significant differences were marked with an asterisk (*) and the respective P value (Student's t test).


