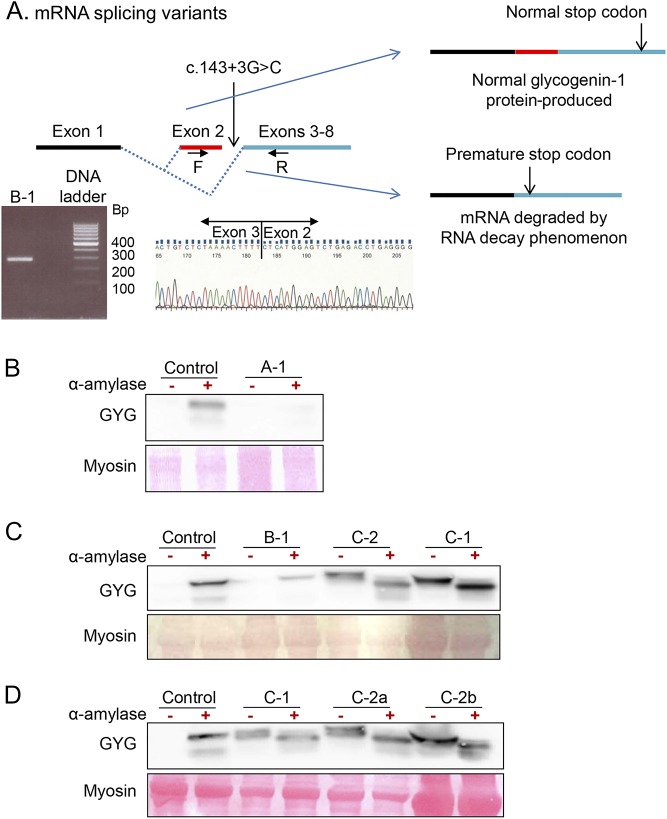
Figure 3. Effect of the mutation c.143+3G>C.
The top panel (A) is a proposed model explaining variable consequences of c.143+3G>C mutation on RNA splicing with production of two mRNA with or without exon 2. Reverse transcriptase PCR (RT-PCR) products using primers F (in exon 2) and R (in exon 4) separated by electrophoresis shows the expected normal band at 290 bp in a patient carrying the c.143+3G>C mutation at homozygote state. Electropherogram represents the reverse RT-PCR product sequence using R primer exhibiting exon 2-exon 3 junction. Western blot studies of glycogenin-1 myoblast cell culture (Panel B, patient A-1) and fresh muscle biopsy (Panel C and D, Patients B-1, C-1 and C-2) without (-) or with (+) alpha-amylase treatment. For each panel, the corresponding sex and age matched control tissue was used.

