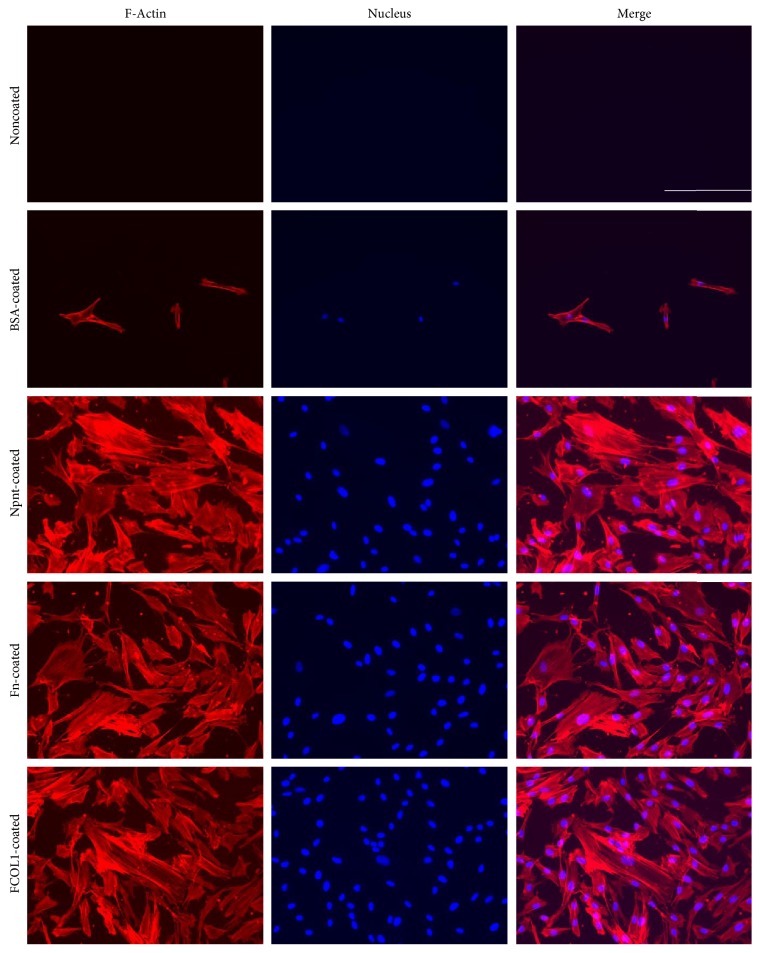
Figure 3.
Organization of actin stress fibers. Fluorescence microscopy photographs of hDPSCs that adhered and spread on polystyrene presenting Npnt. As positive controls, cells attached to substrate(s) having adsorbed layers of Fn and FCOL1. Actin stress fibers were visualized with Alexa Fluor 568-conjugated phalloidin (red-orange), and nuclei were visualized with DAPI (blue). The scale bar in merge photo of noncoated group applies to all panels (scale bar: 200 μm).

