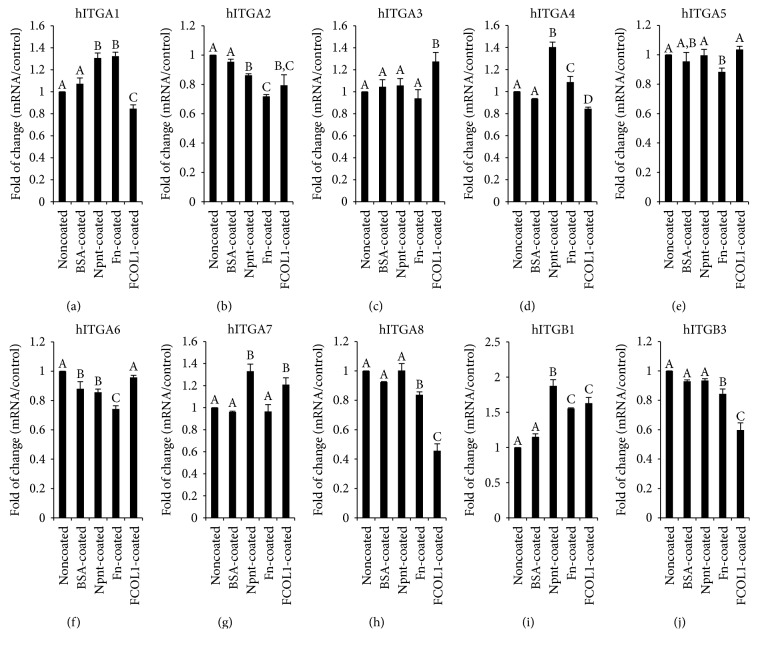
Figure 6.
Real-time RT-PCR of integrins on day five. hDPSCs (passage number 2) were inoculated at the concentration of 1 × 10⁴/mL in 12-well plates (nontissue culture-treated polystyrene, Falcon) in DMEM supplemented with 10% FBS and penicillin/streptomycin (pen: 50 U/mL; strep: 50 μg/mL) and cultured for five days. RNA was isolated at day five and reverse transcribed into cDNA. The quantitative mRNA expression of integrin α1 (ITGA1, (a)), α2 (ITGA2, (b)), α3 (ITGA3, (c)), α4 (ITGA4, (d)), α5 (ITGA5, (e)), α6 (ITGA6, (f)), α7 (ITGA7, (g)), α8 (ITGA8, (h)), β1 (ITGB1, (i)), and β3 (ITGB3, (j)) was determined by real-time RT-PCR. Results are shown as fold increase in relation to the noncoated control and represent the mean ± STD of three independent experiments. Different symbols mean significant differences in each separate panel, p < 0.01 (except for p < 0.05 between BSA-coated and Npnt-coated in (b); noncoated and Fn-coated and BSA-coated and FCOL1-coated in (d); Noncoated and Fn-coated and Npnt-coated and Fn-coated in (e); BSA-coated and FCOL1-coated in (f); BSA-coated and Fn-coated in (h); and BSA-coated and Fn-coated in (j)) by post hoc Tukey's HSD test.

